
 1 / 23 photos


About This Property
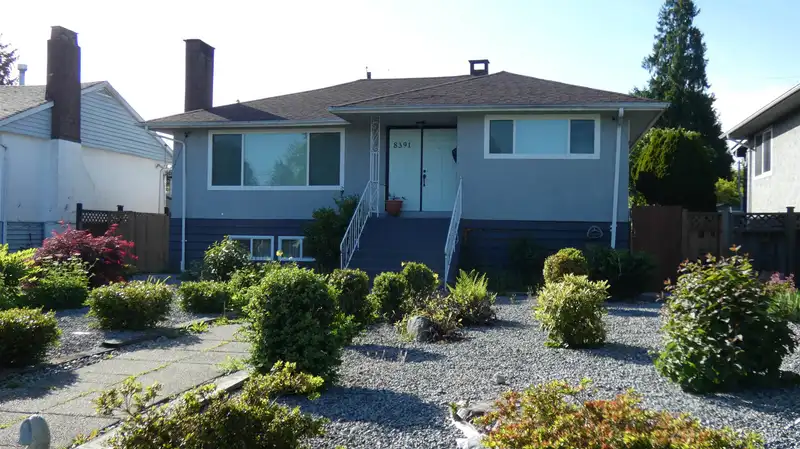
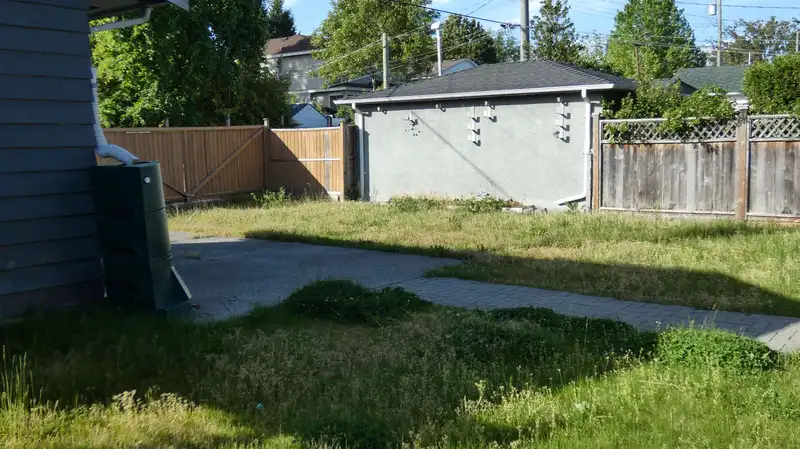
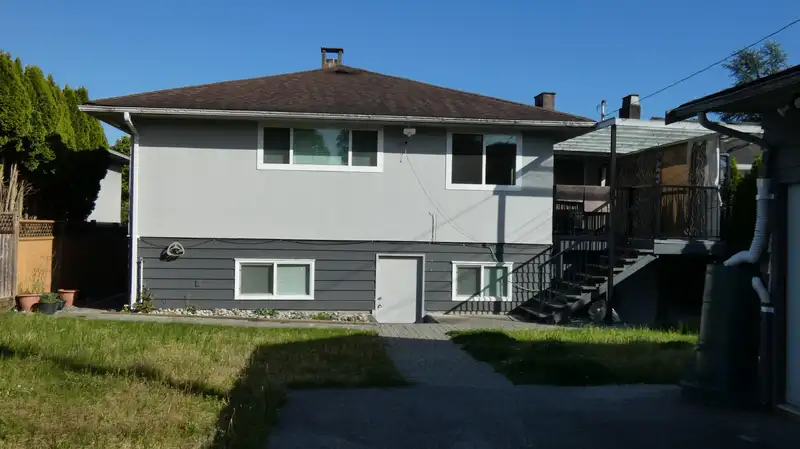
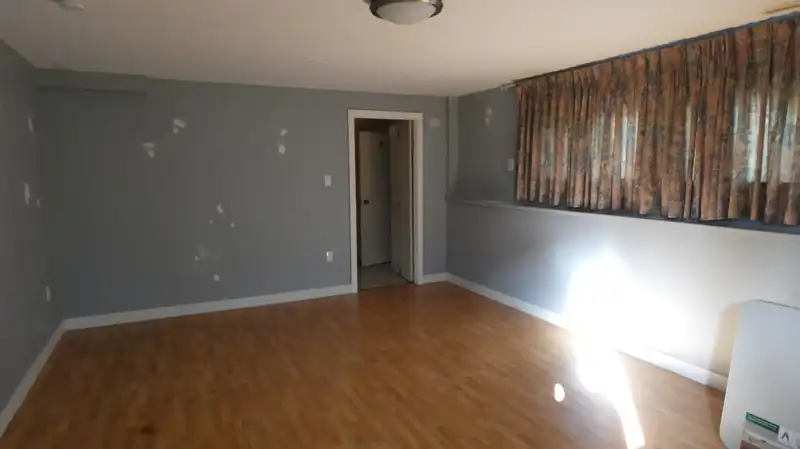
PRIME EAST BURNABY LOCATION! Move in, invest, or build. City of Burnaby has confirmed* 4-unit SSMUH eligibility on this 7,191 sq ft lot with 51 ft frontage and lane access. Main floor: 3 bedrooms, den, 2 full baths, spacious living areas and a large granite kitchen. Basement: 2-bed, 1-bath suite with kitchen, laundry and private entrance, plus a 1-bed,…

Thinking of selling in East Burnaby?
See what your home could be worth and how the local market is moving.
Features
Property Details
School Catchment
Neighbourhood
Age
- Under 1516.6%
- 15 to 6464%
- 65 and over19.4%
Household size
- 1 person16.3%
- 228.1%
- 320.3%
- 421.2%
- 5 or more14.1%
Language spoken at home
47.9% English mother tongue
Mother tongue, share of 7,005 residents.
How this pocket differs
- fewer people living alone than Burnaby East 16.3% vs 21.5%
- more 4-person households than Burnaby East 21.2% vs 16.8%
- notably more Korean speakers than Burnaby East 3.9% vs 2.2%
- notably fewer Mandarin speakers than Burnaby East 6.9% vs 10.4%
- Median dwelling value is higher than Metro Vancouver $1,300,000 vs $1,050,000
Source: Statistics Canada, Census of Population, 2021. Reproduced and distributed on an "as is" basis with the permission of Statistics Canada.
Recent nearby sales
Sold prices are available to registered users. Log in to see what these sold for.
Monthly Cost Calculator
An estimate only. Canadian semi-annual compounding; excludes utilities, closing costs and BC property transfer tax. 5-year fixed, as of Nov 3
Similar Listings Nearby
40 E TENTH AVENUE
50 E 10TH AVENUE
8259 10TH AVENUE
8247 10TH AVENUE
112 TENTH AVENUE
131 RICKMAN PLACE
7507 WRIGHT STREET
201 OSBORNE AVENUE
7888 COQUITLAM STREET
112 DURHAM STREET
8085 10TH AVENUE
215 NINTH AVENUE