
 1 / 31 photos






About This Property
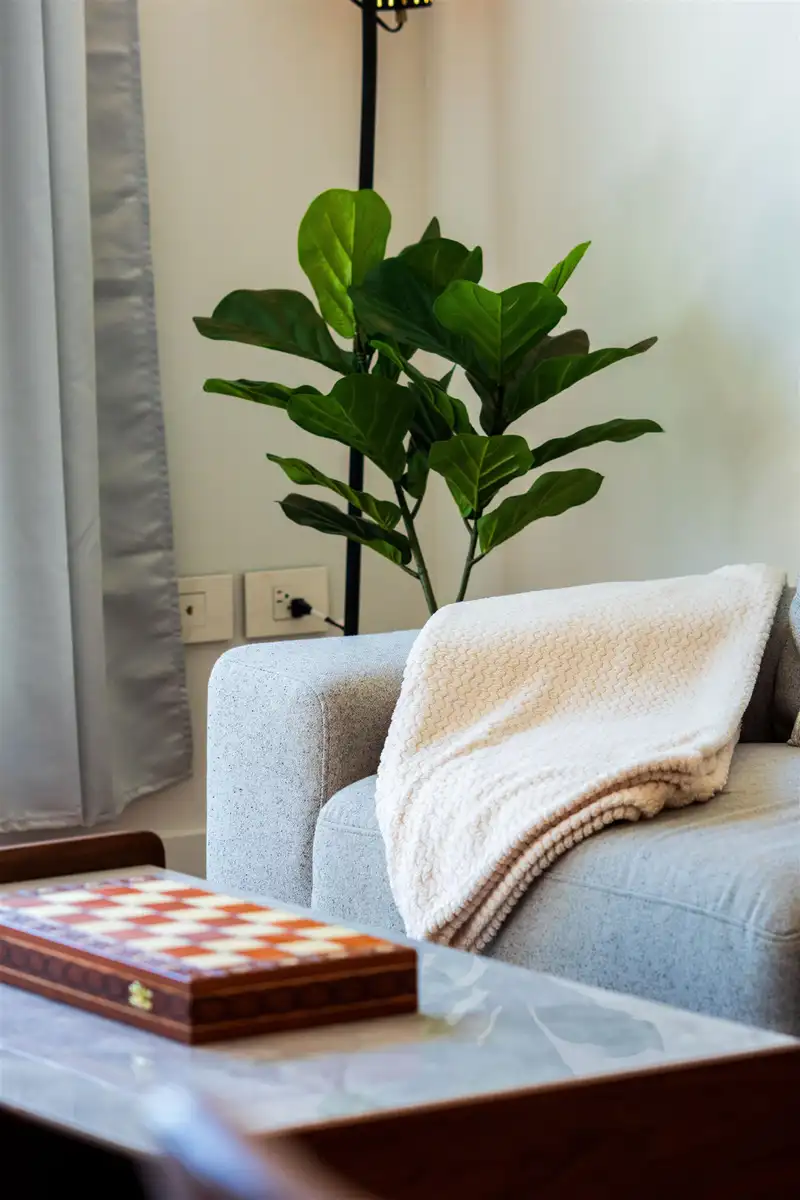
Experience West Side living at BELPARK by Intracorp, ideally positioned beside the expansive greenery of Winona Park. //This 662 sq. ft. air conditioned residence pairs sophisticated finishes with a highly functional one-bedroom layout. //The kitchen is appointed with Gaggenau appliances, a marble backsplash, and a generous quartz island, creating a refined…

Thinking of selling in South Cambie?
See what your home could be worth and how the local market is moving.
Features
Property Details
School Catchment
Neighbourhood
Age
- Under 1510%
- 15 to 6473.4%
- 65 and over16.6%
Household size
- 1 person36.2%
- 234.2%
- 313.8%
- 49.7%
- 5 or more6.2%
Language spoken at home
27.6% English mother tongue
Mother tongue, share of 6,930 residents.
How this pocket differs
- notably more Punjabi speakers than Marpole 3.1% vs 1.6%
- notably more Korean speakers than Marpole 3% vs 1.7%
- more Mandarin speakers than Marpole 19.8% vs 15.6%
- more Cantonese speakers than Marpole 20.1% vs 16.4%
- Median household income is lower than Metro Vancouver $69,500 vs $90,000
- Median dwelling value is higher than Metro Vancouver $1,340,000 vs $1,050,000
Source: Statistics Canada, Census of Population, 2021. Reproduced and distributed on an "as is" basis with the permission of Statistics Canada.
Recent nearby sales
Sold prices are available to registered users. Log in to see what these sold for.
Monthly Cost Calculator
An estimate only. Canadian semi-annual compounding; excludes utilities, closing costs and BC property transfer tax. 5-year fixed, as of Nov 16
Similar Listings Nearby
203 7428 ALBERTA STREET
101 7680 COLUMBIA STREET
305 488 W 58TH AVENUE
302 488 W 58TH AVENUE
209 488 W 58TH AVENUE
105 477 W 59TH AVENUE
106 477 W 59TH AVENUE
309 477 W 59TH AVENUE
303 477 W 59TH AVENUE
7529 YUKON STREET
7605 YUKON STREET
409 7418 PAULSON STREET