
 1 / 26 photos





About This Property
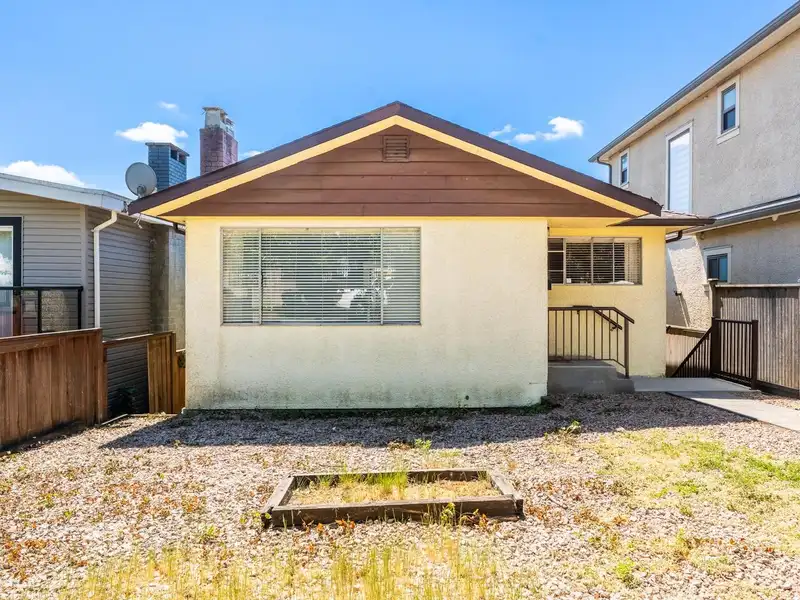
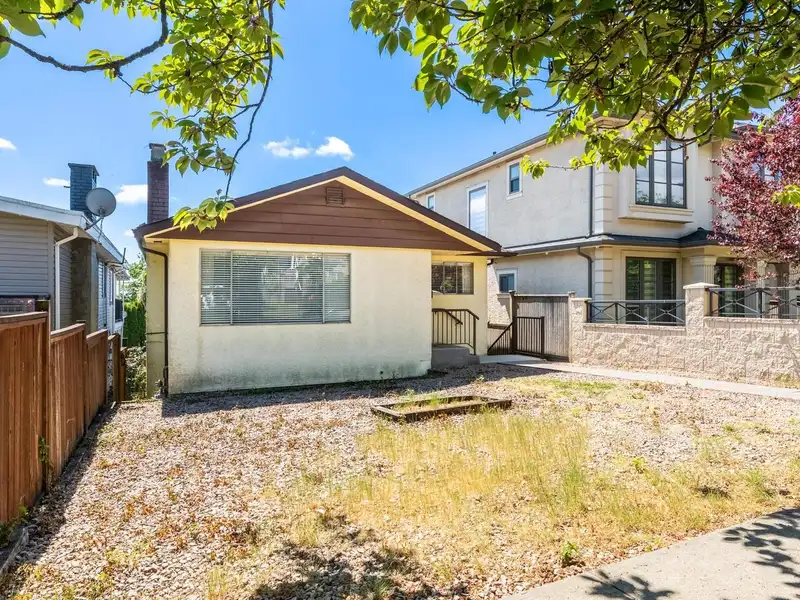
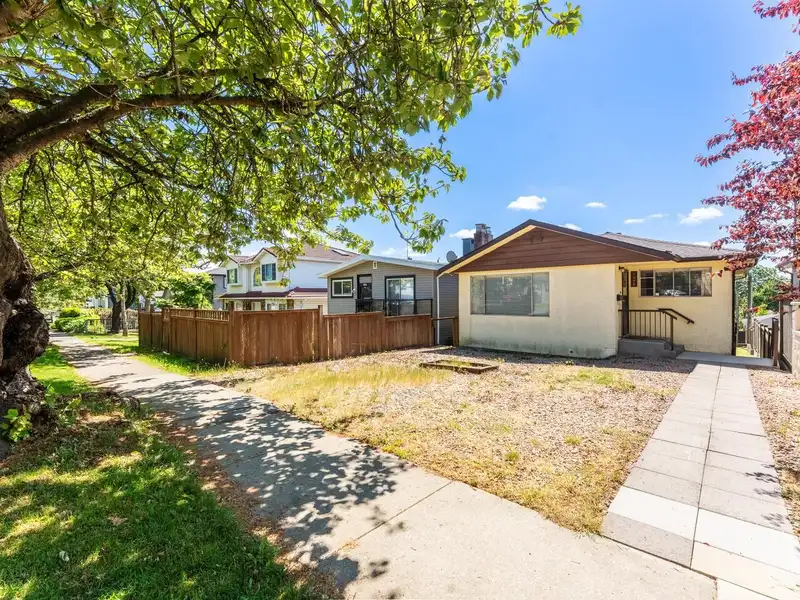
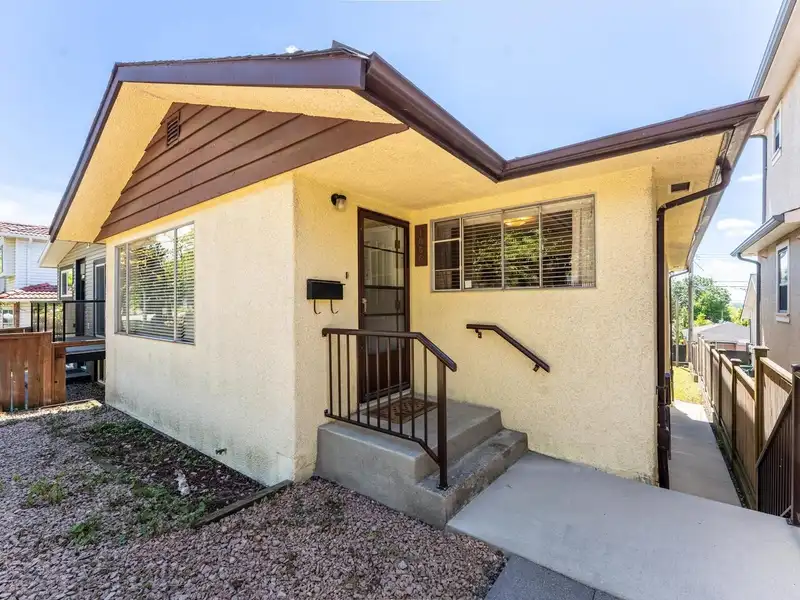
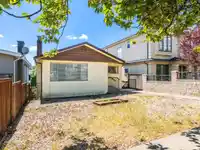
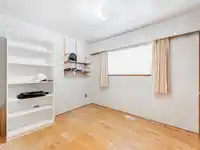
Located in a highly convenient and family-friendly neighborhood. Ideal for first-time buyers or builders. One owner home. Well maintained solid home with great bones - 3 bedroom/ 1 bathroom on main floor (1111sqft). Unfinished basement (1112sqft) with separate entry, roughed in bathroom plumbing & ceiling height of 7ft 9inch. Property features oak hardwood…
Features
Property Details
School Catchment
Neighbourhood
Age
- Under 1512.8%
- 15 to 6471%
- 65 and over16.2%
Household size
- 1 person19.1%
- 222.4%
- 319.1%
- 418.4%
- 5 or more21%
Language spoken at home
25.5% Punjabi mother tongue
Mother tongue, share of 4,420 residents.
How this pocket differs
- fewer Cantonese speakers than South Vancouver 9.2% vs 13.5%
- more Tagalog speakers than South Vancouver 10.3% vs 8.2%
- more Punjabi speakers than South Vancouver 25.5% vs 20.4%
- Median dwelling value is notably higher than Metro Vancouver $1,600,000 vs $1,050,000
Source: Statistics Canada, Census of Population, 2021. Reproduced and distributed on an "as is" basis with the permission of Statistics Canada.


Thinking of selling in South Vancouver?
See what your home could be worth and how the local market is moving.
Recent nearby sales
Sold prices are available to registered users. Log in to see what these sold for.
Monthly Cost Calculator
An estimate only. Canadian semi-annual compounding; excludes utilities, closing costs and BC property transfer tax. 5-year fixed, as of Aug 20
Similar Listings Nearby
7882 WINDSOR STREET
7808 ROSS STREET
748 E 62ND AVENUE
912 E 57TH AVENUE
1372 E 64TH AVENUE
7202 ROSS STREET
7654 FRASER STREET
7429 FRASER STREET
638 E 61ST AVENUE
648 E 65TH AVENUE
726 E 56TH AVENUE
586 E 60TH AVENUE