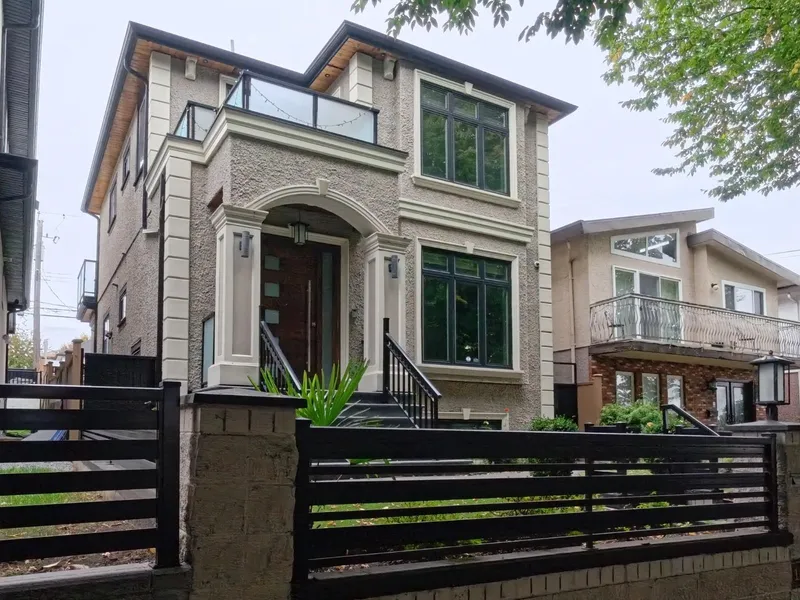
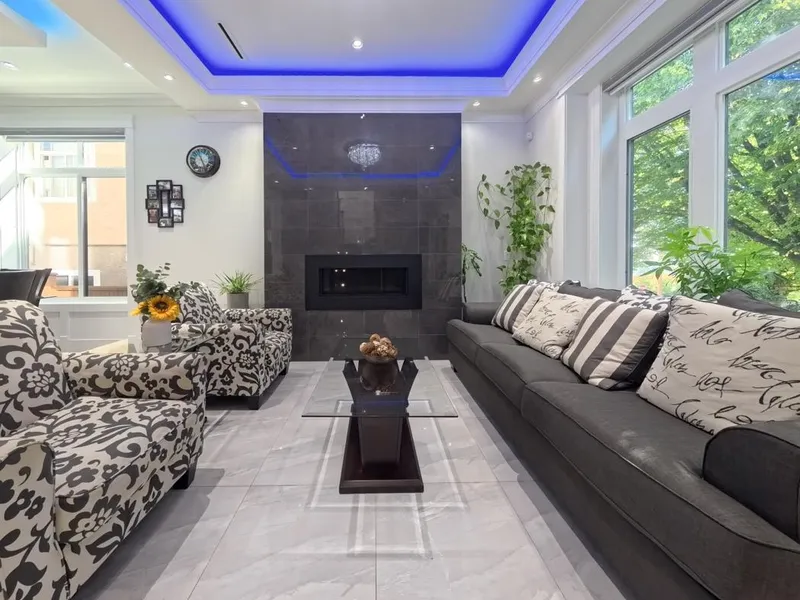
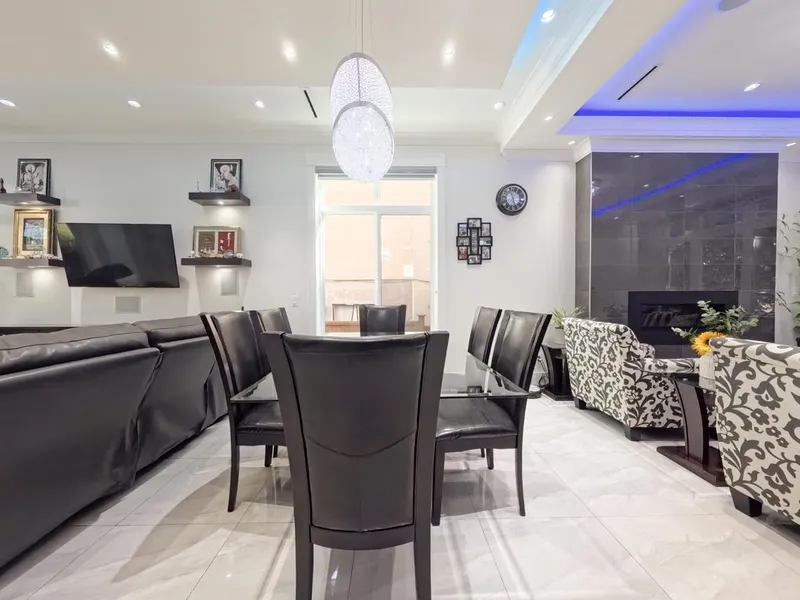
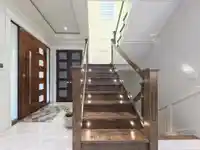
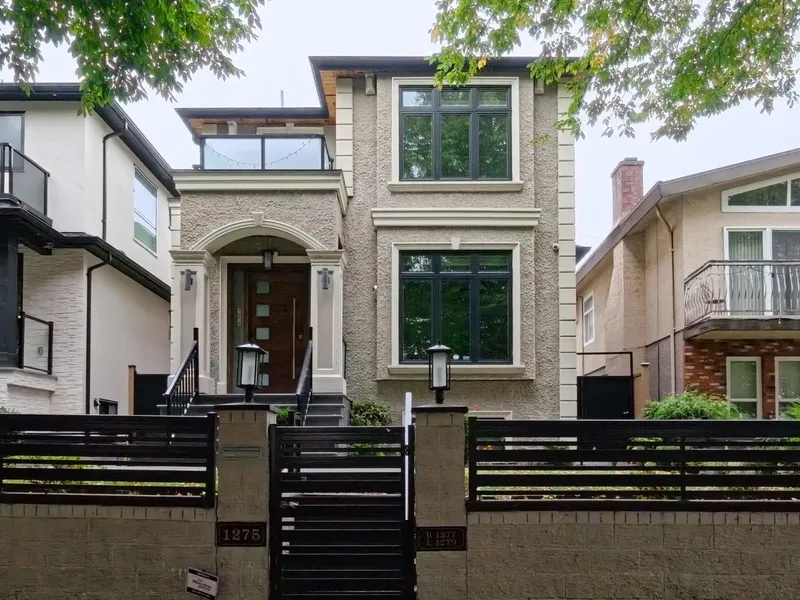
Convenient South Vancouver Location – Builder’s Own Custom Home! This beautifully crafted home offers everything you’re looking for: an open-concept main floor w/ soaring 10-ft ceilings, gourmet + wok kitchens, high-end JENN-AIR appliances & custom millwork throughout — all with exceptional attention to detail. 4 generously sized bedrooms on upper floor.…
Convenient South Vancouver Location – Builder’s Own Custom Home! This beautifully crafted home offers everything you’re looking for: an open-concept main floor w/ soaring 10-ft ceilings, gourmet + wok kitchens, high-end JENN-AIR appliances & custom millwork throughout — all with exceptional attention to detail. 4 generously sized bedrooms on upper floor. The basement features a 2-bedroom legal suite + a separate 1-bedroom suite,offering excellent rental income/space for extended family. A 1-bedroom laneway house adds even more value as a mortgage helper. AC, Radian heat & home audio system with speakers throughout. Walter Moberly Elementary and David Thompson Secondary catchment. Easy access to Richmond/DT/Oakridge and Metrotown. Don't miss out - Call today to book your private showing !
Features
Balcony
Carport Single
Garage Single
Room measurements16 rooms▸
FoyerMain · 5'8 × 9'9
Living RoomMain · 12'7 × 12'11
Dining RoomMain · 10'2 × 12'11
Family RoomMain · 11'6 × 11'4
KitchenMain · 13'11 × 11'4
Wok KitchenMain · 5'3 × 10'8
Primary BedroomAbove · 11'3 × 12'2
BedroomAbove · 8'11 × 10'2
BedroomAbove · 9'0 × 12'8
BedroomAbove · 7'8 × 8'8
KitchenBelow · 13'0 × 10'6
BedroomBelow · 8'0 × 7'0
BedroomBelow · 9'8 × 10'6
DenBelow · 7'3 × 10'5
Flex RoomBelow · 11'4 × 10'5
LaundryBelow · 4'6 × 10'5
Floor plan
🔍 Tap to zoom
Pinch or scroll to zoom · drag to pan · double-tap to reset
Property Details
MLS NumberR3079192
Property TypeSingle Family Residence
Bedrooms6
Bathrooms5
Square Feet2,670
Lot Size3,791.7 sqft
Year Built2016
Parking Spaces2
HeatingRadiant
StatusClosed
Listed ByRE/MAX Real Estate Services
School Catchment
ElementaryMoberly
SecondaryDavid Thompson
Neighbourhood
Highlighted area = this home's census tract (StatCan), the boundary the neighbourhood stats describe.
$1,600,000Median home value
$91,000Median household income
47.6%Owner-occupied
17.5%Single-detached homes
3.2Avg household size
37.2Median age
34.7%Bachelor's degree or higher (25-64)
55.1%Commute under 30 min
61.9%Drive to work
58.4%Foreign-born residents
4,519Neighbourhood population
Age
Under 1512.8%
15 to 6471%
65 and over16.2%
Household size
1 person19.1%
222.4%
319.1%
418.4%
5 or more21%
Language spoken at home
25.5% Punjabi mother tongue
English24.2%
Tagalog10.3%
Cantonese9.2%
English + other8.7%
Hindi2.8%
Vietnamese2.8%
All others16.5%
Mother tongue, share of 4,420 residents.
How this pocket differs
fewer Cantonese speakers than South Vancouver 9.2% vs 13.5%
more Tagalog speakers than South Vancouver 10.3% vs 8.2%
more Punjabi speakers than South Vancouver 25.5% vs 20.4%
Median dwelling value is notably higher than Metro Vancouver $1,600,000 vs $1,050,000
Source: Statistics Canada, Census of Population, 2021. Reproduced and distributed on an "as is" basis with the permission of Statistics Canada.
Ped NaimiPersonal Real Estate Corp
Vinod BashirPersonal Real Estate Corp
Thinking of selling in South Vancouver?
See what your home could be worth and how the local market is moving.

 1 / 40 photos