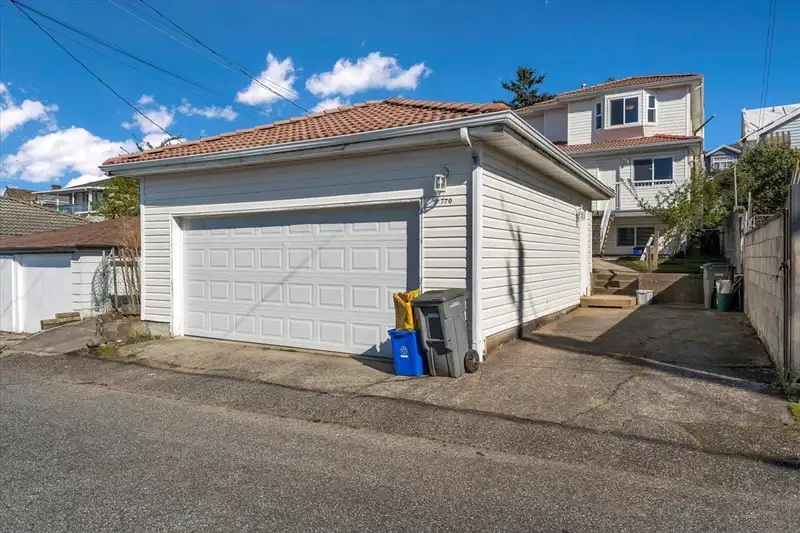
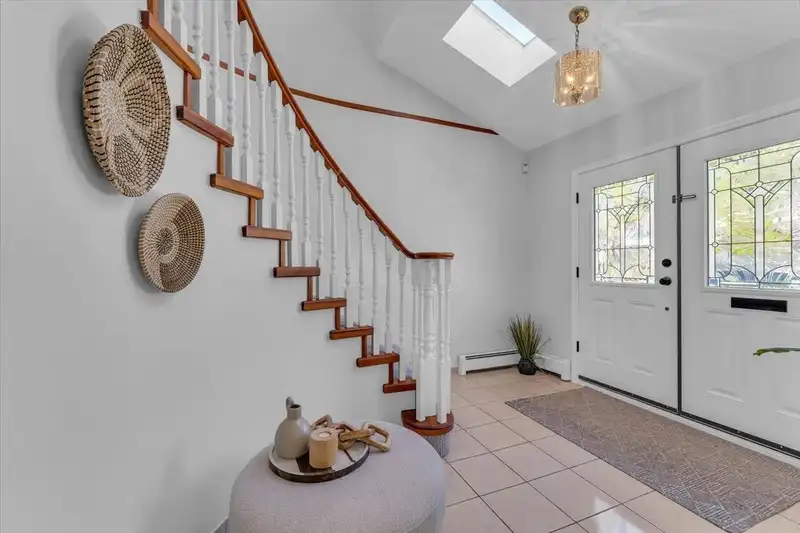
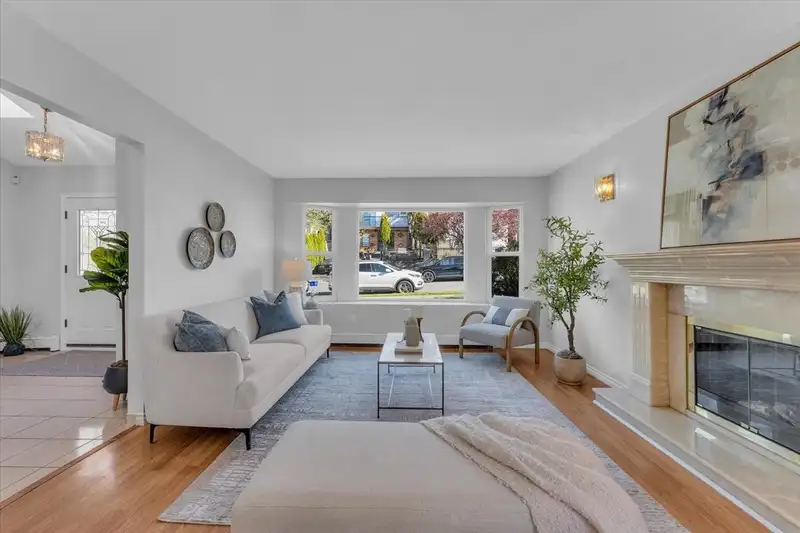
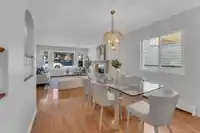
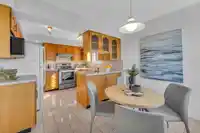
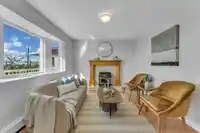
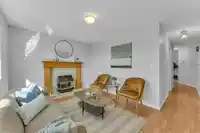
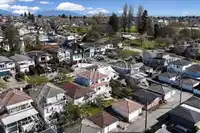
Outstanding south-facing view residence offering warmth, elegance, and versatility in a welcoming, family-oriented neighbourhood. Bathed in natural light, this beautifully cared-for home features 4 bedrooms and a generous family room above, complemented by a fully renovated 1-bedroom suite below-ideal for extended family or an inspired mortgage helper. The…
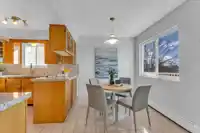
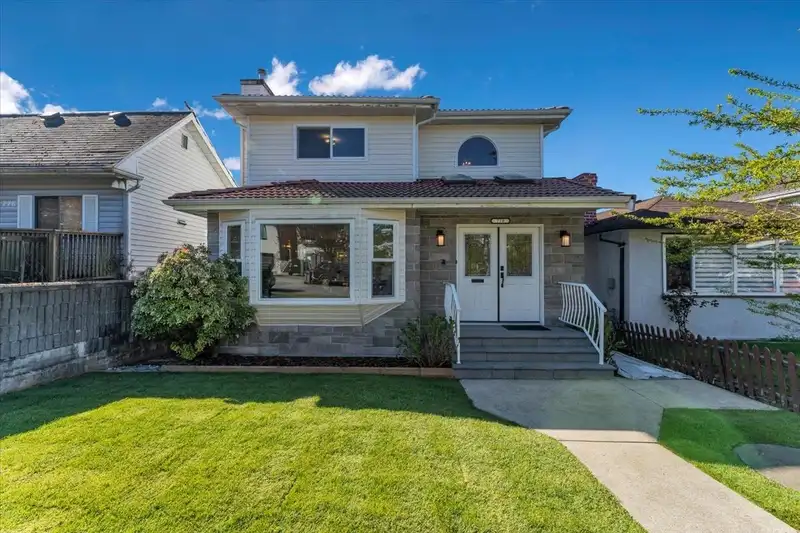
Outstanding south-facing view residence offering warmth, elegance, and versatility in a welcoming, family-oriented neighbourhood. Bathed in natural light, this beautifully cared-for home features 4 bedrooms and a generous family room above, complemented by a fully renovated 1-bedroom suite below-ideal for extended family or an inspired mortgage helper. The main living spaces invite connection and comfort, with multiple skylights, gas fireplace, and a bright, functional kitchen designed for everyday living and effortless entertaining. Rl-1 zoning allows for more flexibility than older family zoning. Single detached secondary suite and laneway house potential for multi-unit (duplex or multiplex options) please verify with City -Open Sat & Sun 2-4
Features
Storage
Garden
Additional Parking
Garage Double
Open
Lane Access
Rear Access
Shopping Nearby
Room measurements12 rooms▸
Living RoomMain · 14'0 × 16'0
Dining RoomMain · 9'0 × 10'0
KitchenMain · 10'0 × 16'0
Family RoomMain · 10'0 × 10'0
BedroomMain · 10'0 × 10'0
Primary BedroomAbove · 12'0 × 14'0
BedroomAbove · 10'0 × 10'0
BedroomAbove · 10'0 × 11'0
Living RoomBelow · 9'0 × 12'0
KitchenBelow · 9'0 × 12'0
BedroomBelow · 11'0 × 11'0
Flex RoomBelow · 3'0 × 7'0
Floor plan
🔍 Tap to zoom
Pinch or scroll to zoom · drag to pan · double-tap to reset
Property Details
MLS NumberR3110743
Property TypeSingle Family Residence
Bedrooms5
Bathrooms4
Square Feet2,404
Lot Size4,026 sqft
Year Built1991
Parking Spaces2
HeatingHot Water, Natural Gas
StatusClosed
Listed ByRE/MAX Masters Realty
School Catchment
ElementaryMoberly
SecondaryJohn Oliver
Neighbourhood
Highlighted area = this home's census tract (StatCan), the boundary the neighbourhood stats describe.
$1,600,000Median home value
$91,000Median household income
47.6%Owner-occupied
17.5%Single-detached homes
3.2Avg household size
37.2Median age
34.7%Bachelor's degree or higher (25-64)
55.1%Commute under 30 min
61.9%Drive to work
58.4%Foreign-born residents
4,519Neighbourhood population
Age
Under 1512.8%
15 to 6471%
65 and over16.2%
Household size
1 person19.1%
222.4%
319.1%
418.4%
5 or more21%
Language spoken at home
25.5% Punjabi mother tongue
English24.2%
Tagalog10.3%
Cantonese9.2%
English + other8.7%
Hindi2.8%
Vietnamese2.8%
All others16.5%
Mother tongue, share of 4,420 residents.
How this pocket differs
fewer Cantonese speakers than South Vancouver 9.2% vs 13.5%
more Tagalog speakers than South Vancouver 10.3% vs 8.2%
more Punjabi speakers than South Vancouver 25.5% vs 20.4%
Median dwelling value is notably higher than Metro Vancouver $1,600,000 vs $1,050,000
Source: Statistics Canada, Census of Population, 2021. Reproduced and distributed on an "as is" basis with the permission of Statistics Canada.
Ped NaimiPersonal Real Estate Corp
Vinod BashirPersonal Real Estate Corp
Thinking of selling in South Vancouver?
See what your home could be worth and how the local market is moving.

 1 / 38 photos