
 1 / 40 photos








About This Property
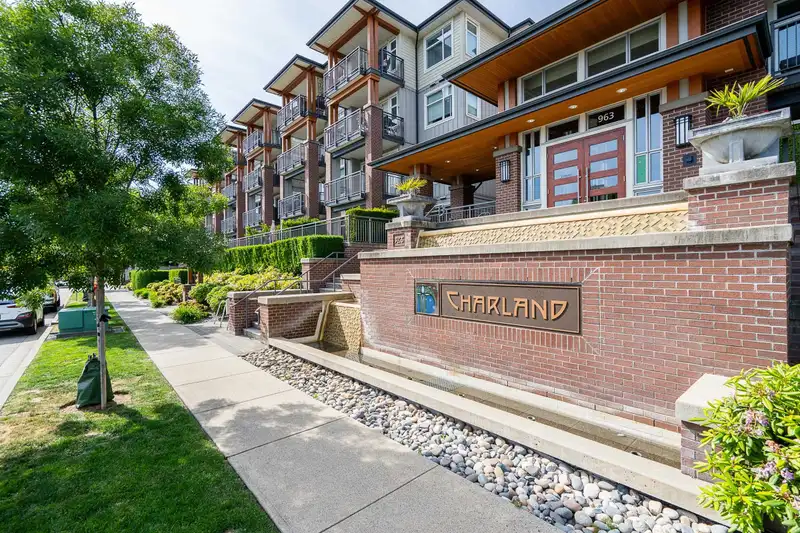
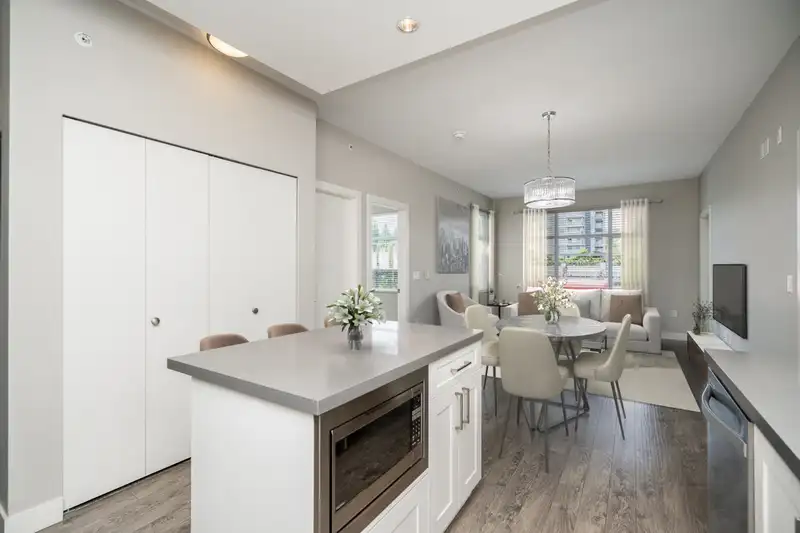
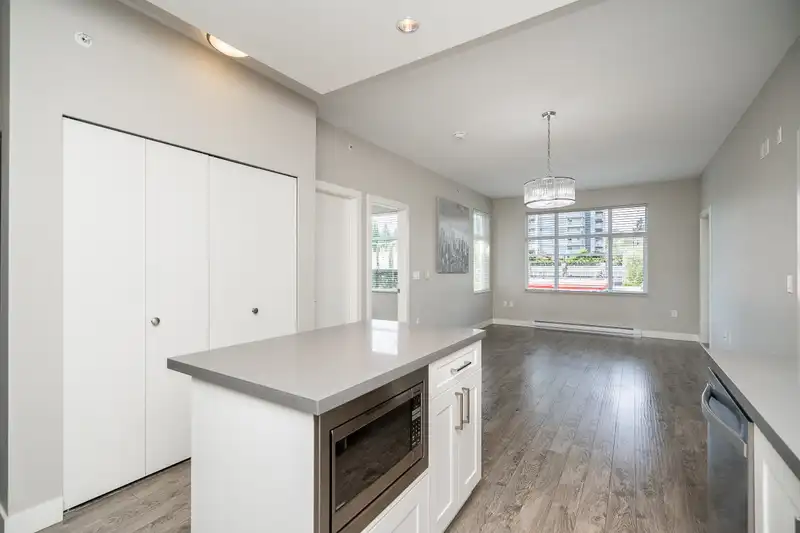
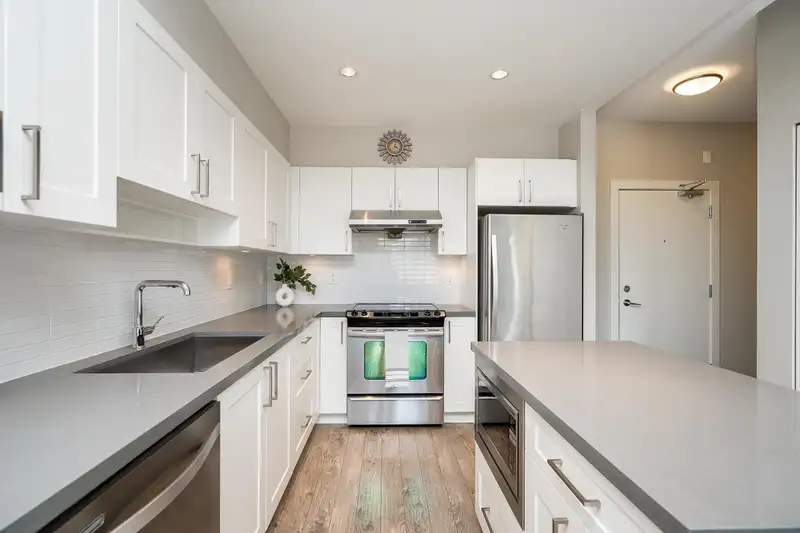
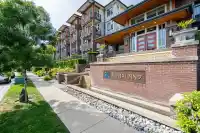
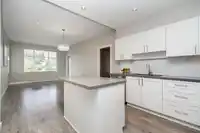
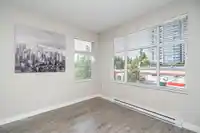
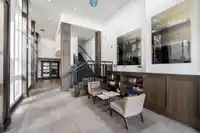
Welcome to Charland by Ledingham McAllister—a modern, well-built home in a prime location! This end unit offers 2 beds, a den, and 2 baths with 878 sq ft of functional living space. The open layout has a spacious kitchen w/pot lights, an island, quartz counters, shaker style cabinets, and S/S appliances. The living and dining flow seamlessly to a covered…
Features
Property Details
School Catchment
Neighbourhood
Age
- Under 1513.7%
- 15 to 6469.9%
- 65 and over16.4%
Household size
- 1 person25.8%
- 230.6%
- 318.1%
- 415.3%
- 5 or more10.2%
Language spoken at home
44.9% English mother tongue
Mother tongue, share of 4,610 residents.
How this pocket differs
- notably more Punjabi speakers than Coquitlam 3% vs 0.8%
- notably more Tagalog speakers than Coquitlam 3.7% vs 1.7%
- fewer Mandarin speakers than Coquitlam 7.2% vs 9.7%
- more Korean speakers than Coquitlam 9.2% vs 6.8%
Source: Statistics Canada, Census of Population, 2021. Reproduced and distributed on an "as is" basis with the permission of Statistics Canada.


Thinking of selling in Central Coquitlam?
See what your home could be worth and how the local market is moving.
Recent nearby sales
Sold prices are available to registered users. Log in to see what these sold for.
Monthly Cost Calculator
An estimate only. Canadian semi-annual compounding; excludes utilities, closing costs and BC property transfer tax. 5-year fixed, as of Aug 19
Similar Listings Nearby
2201 963 CHARLAND AVENUE
1006 958 RIDGEWAY AVENUE
301 535 BLUE MOUNTAIN STREET
2002 505 NELSON STREET
112 1000 KING ALBERT AVENUE
2307 505 NELSON STREET
1004 505 NELSON STREET
1401 505 NELSON STREET
1603 505 NELSON STREET
2102 505 NELSON STREET
2207 505 NELSON STREET
2404 505 NELSON STREET