
 1 / 32 photos










About This Property
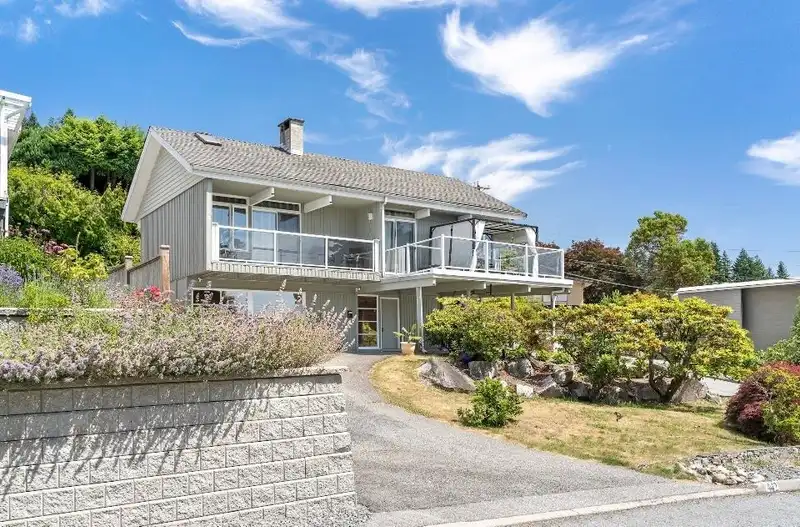
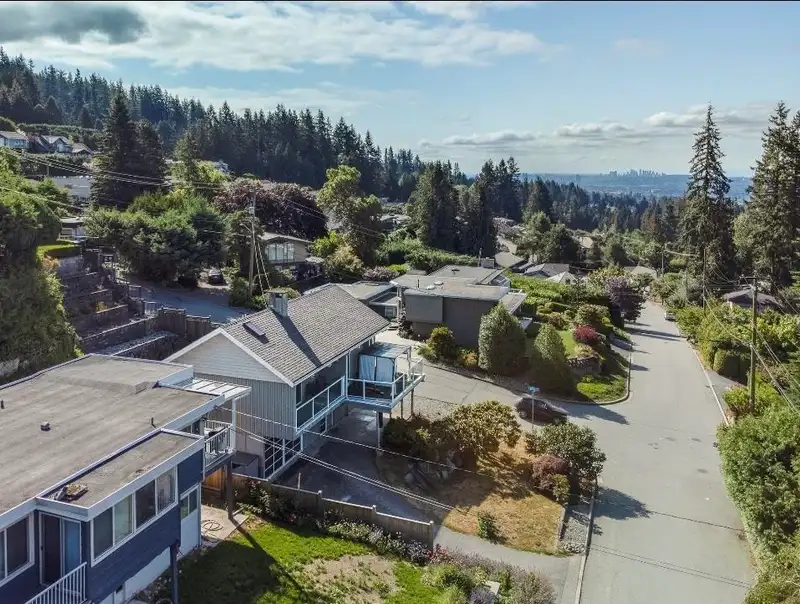
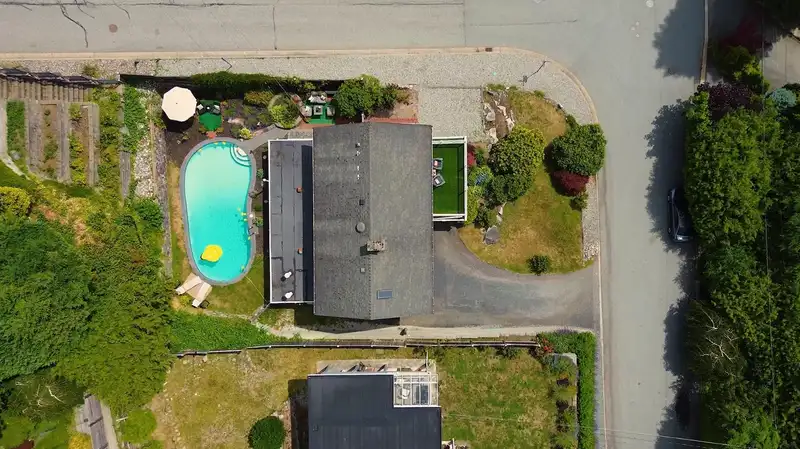
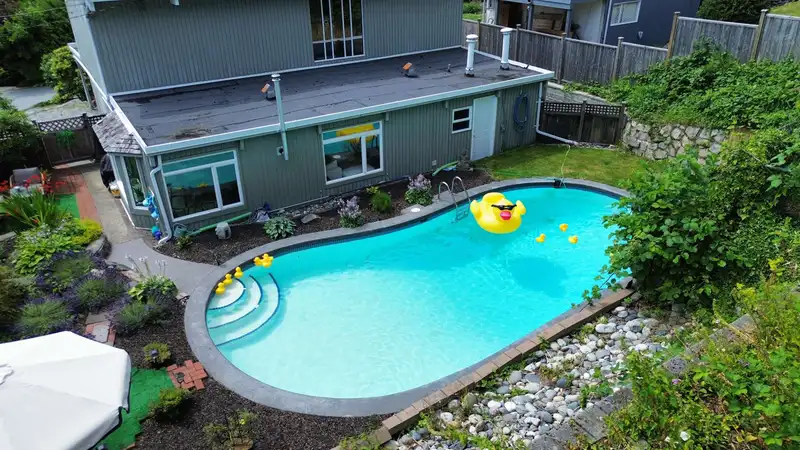
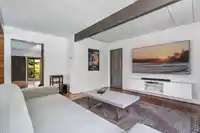
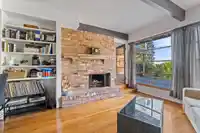
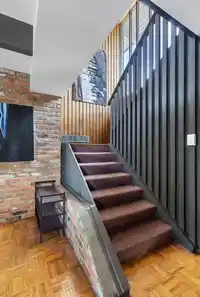
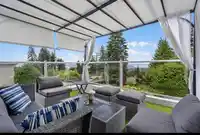
Perched on a beautifully landscaped corner property, this timeless post and beam home captures stunning city and Vancouver Harbour views. Thoughtfully updated while preserving its architectural charm, it features oversized kitchen w/ quartz counters, s/s appliances, shaker cabinetry + generous workspace flowing into bright living and dining rms with large…
Features
Property Details
School Catchment
Neighbourhood
Age
- Under 1514.6%
- 15 to 6463.2%
- 65 and over22.2%
Household size
- 1 person17.4%
- 233.6%
- 318.9%
- 420.7%
- 5 or more9.4%
Language spoken at home
62.9% English mother tongue
Mother tongue, share of 6,260 residents.
How this pocket differs
- more seniors 65+ than North Vancouver 22.2% vs 18.5%
- notably fewer people living alone than North Vancouver 17.4% vs 28.4%
- more 5+ person households than North Vancouver 9.4% vs 6.4%
- more 4-person households than North Vancouver 20.7% vs 15.5%
- notably more Farsi speakers than North Vancouver 13.7% vs 8%
- Median household income is higher than Metro Vancouver $130,000 vs $90,000
- Median dwelling value is notably higher than Metro Vancouver $2,000,000 vs $1,050,000
Source: Statistics Canada, Census of Population, 2021. Reproduced and distributed on an "as is" basis with the permission of Statistics Canada.


Thinking of selling in Upper Delbrook?
See what your home could be worth and how the local market is moving.
Recent nearby sales
Sold prices are available to registered users. Log in to see what these sold for.
Monthly Cost Calculator
An estimate only. Canadian semi-annual compounding; excludes utilities, closing costs and BC property transfer tax. 5-year fixed, as of Sep 1
Similar Listings Nearby
454 MONTERAY AVENUE
463 VENTURA CRESCENT
403 NEWDALE COURT
353 NEWDALE COURT
472 CRESTWOOD AVENUE
531 GREENWAY AVENUE
550 VENTURA CRESCENT
4323 VALENCIA AVENUE
468 SAVILLE CRESCENT
674 BLUERIDGE AVENUE
187 RONDOVAL CRESCENT
4066 NORWOOD AVENUE