
 1 / 40 photos














About This Property
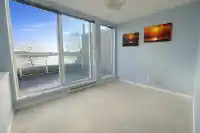
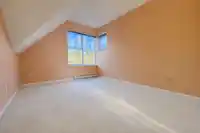
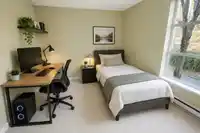
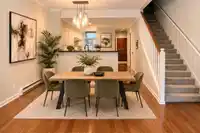
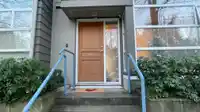
If you believe water brings good fortune and prosperity, this waterfront home is worth a closer look. 3 bed, 4 bath townhouse with an upper-level flex room ideal as a 4th bedroom, office or media room, opening to a private 150 sq. ft. deck. Updated kitchen with stainless steel appliances & quartz countertops. Smart thermostats, security camera & video…

Thinking of selling in South Marine?
See what your home could be worth and how the local market is moving.
Features
Property Details
School Catchment
Neighbourhood
Age
- Under 1512.6%
- 15 to 6462.2%
- 65 and over25.2%
Household size
- 1 person25.2%
- 229.9%
- 318.6%
- 414.2%
- 5 or more12.3%
Language spoken at home
42.9% English mother tongue
Mother tongue, share of 4,360 residents.
How this pocket differs
- more seniors 65+ than South Marine 25.2% vs 17.8%
- notably more 5+ person households than South Marine 12.3% vs 6.9%
- notably more Punjabi speakers than South Marine 5.3% vs 2.3%
- notably fewer Mandarin speakers than South Marine 3% vs 4.7%
Source: Statistics Canada, Census of Population, 2021. Reproduced and distributed on an "as is" basis with the permission of Statistics Canada.
Recent nearby sales
Sold prices are available to registered users. Log in to see what these sold for.
Monthly Cost Calculator
An estimate only. Canadian semi-annual compounding; excludes utilities, closing costs and BC property transfer tax. 5-year fixed, as of Oct 6
Similar Listings Nearby
3 2150 SE MARINE DRIVE
1950 E KENT AVENUE SOUTH
2387 QUAYSIDE COURT
45 2728 CHANDLERY PLACE
38 2723 E KENT AVENUE NORTH
26 2723 E KENT NORTH AVENUE
2866 SOTAO AVENUE
8431 JELLICOE STREET
2836 E KENT AVENUE SOUTH
SL 3 2333 E 54TH AVENUE
SL 1 2333 E 54TH AVENUE
SL 2 2333 E 54TH AVENUE