Rare opportunity to own this well-maintained home situated on a huge 10,800 sq ft flat lot with desirable north-south orientation in a prime Burnaby Location! Backing directly onto a peaceful park with lane access, this property offers exceptional privacy and a spacious, fenced & gated backyard, perfect for entertaining, gardening, kids or pets. Recent…
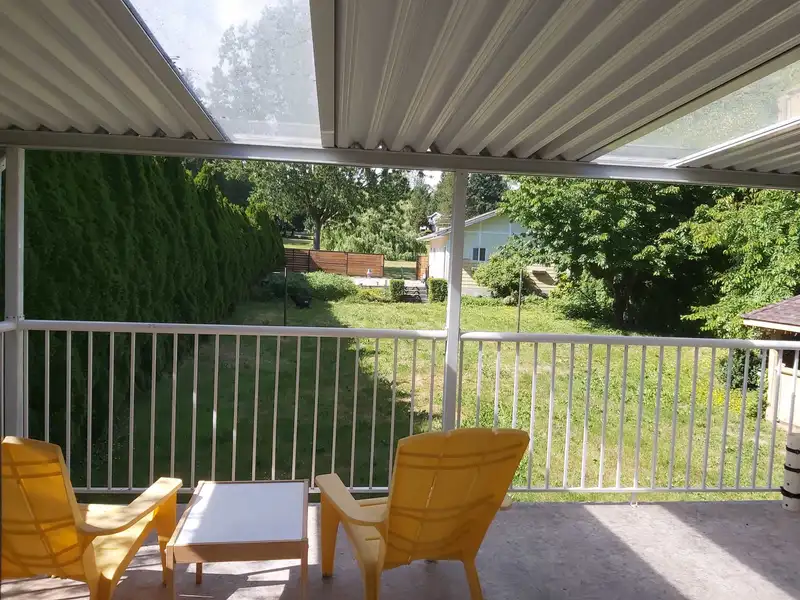
Rare opportunity to own this well-maintained home situated on a huge 10,800 sq ft flat lot with desirable north-south orientation in a prime Burnaby Location! Backing directly onto a peaceful park with lane access, this property offers exceptional privacy and a spacious, fenced & gated backyard, perfect for entertaining, gardening, kids or pets. Recent updates include new paint, updated flooring in selected areas (2026), updated drainage (2025), & newer covered upper sundeck (2014). Functional layout with double garage plus 3 extra secured parking spaces. Conveniently located near parks, schools, transit, shopping & amenities. Excellent opportunity for families, investors, or builders with strong future potential in a highly desirable neighborhood!!
Features
Balcony
Private Yard
Garage Double
RV Access/Parking
Front Access
Lane Access
Garage Door Opener
Shopping Nearby
Room measurements11 rooms▸
Living RoomMain · 14' × 16'6
KitchenMain · 11' × 13'
Dining RoomMain · 9' × 12'
BedroomBelow · 9' × 12'6
Primary BedroomMain · 11' × 11'6
BedroomMain · 10' × 13'
BedroomMain · 9'9 × 12'6
Family RoomBelow · 11' × 20'6
Living RoomBelow · 12'6 × 15'8
DenBelow · 11' × 13'
LaundryBelow · 7' × 7'
Floor plan
🔍 Tap to zoom
Pinch or scroll to zoom · drag to pan · double-tap to reset
Property Details
MLS NumberR3122943
Property TypeSingle Family Residence
Bedrooms4
Bathrooms3
Square Feet2,400
Lot Size10,800 sqft
Year Built1969
Parking Spaces2
HeatingForced Air, Natural Gas
Days on Market130
StatusActive
Listed ByMagsen Realty Inc.
School Catchment
ElementaryGilpin
SecondaryBurnaby Central
Neighbourhood
Highlighted area = this home's census tract (StatCan), the boundary the neighbourhood stats describe.
$1,200,000Median home value
$115,000Median household income
84.7%Owner-occupied
36.3%Single-detached homes
2.8Avg household size
46.4Median age
55.3%Bachelor's degree or higher (25-64)
58.4%Commute under 30 min
83%Drive to work
40.5%Foreign-born residents
5,334Neighbourhood population
Age
Under 1514%
15 to 6465%
65 and over21%
Household size
1 person18.8%
232.6%
318.8%
419%
5 or more10.9%
Language spoken at home
52.3% English mother tongue
Mandarin11.4%
Cantonese6.6%
English + other4.3%
Punjabi2.6%
Korean2.1%
Tagalog1.5%
All others19.2%
Mother tongue, share of 5,335 residents.
How this pocket differs
notably fewer people living alone than Burnaby South 18.8% vs 30.4%
notably more 4-person households than Burnaby South 19% vs 12.3%
more 5+ person households than Burnaby South 10.9% vs 7.7%
notably fewer Cantonese speakers than Burnaby South 6.6% vs 11.4%
notably fewer Mandarin speakers than Burnaby South 11.4% vs 17.4%
Median household income is higher than Metro Vancouver $115,000 vs $90,000
Source: Statistics Canada, Census of Population, 2021. Reproduced and distributed on an "as is" basis with the permission of Statistics Canada.
Ped NaimiPersonal Real Estate Corp
Vinod BashirPersonal Real Estate Corp
Thinking of selling in Deer Lake Place?
See what your home could be worth and how the local market is moving.

 1 / 1 photos

