
 1 / 1 photos
About This Property
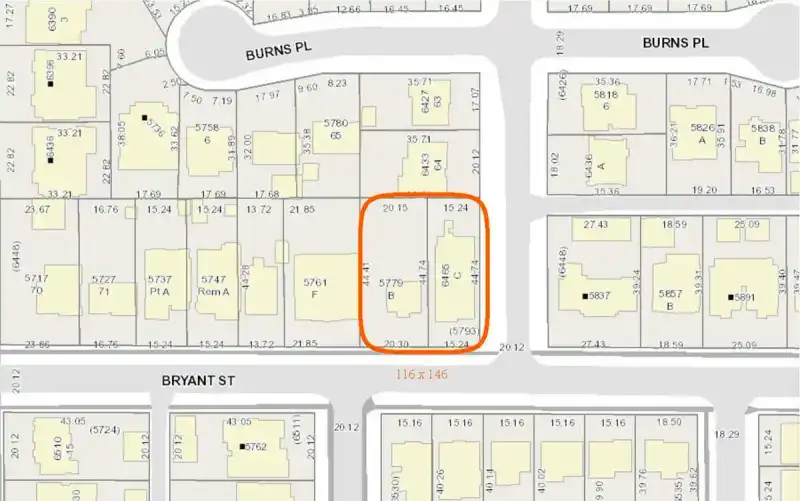
Prime mixed use development opportunity. 5779 Bryant street & 6465 Kisbey ave. must be sold together for a combined asing price of $5,980,000.00. Potential to build 12 row houses.
Features
Property Details
School Catchment
Neighbourhood
Age
- Under 1513.9%
- 15 to 6468.4%
- 65 and over17.7%
Household size
- 1 person15.6%
- 227.1%
- 320.7%
- 419.6%
- 5 or more17%
Language spoken at home
34.3% English mother tongue
Mother tongue, share of 5,845 residents.
How this pocket differs
- notably more 5+ person households than Burnaby South 16.9% vs 7.7%
- notably fewer people living alone than Burnaby South 15.6% vs 30.4%
- notably more 4-person households than Burnaby South 19.6% vs 12.3%
- notably more Punjabi speakers than Burnaby South 3.6% vs 2.3%
- more Mandarin speakers than Burnaby South 21.3% vs 17.4%
- Median dwelling value is notably higher than Metro Vancouver $1,760,000 vs $1,050,000
Source: Statistics Canada, Census of Population, 2021. Reproduced and distributed on an "as is" basis with the permission of Statistics Canada.


Thinking of selling in Upper Deer Lake?
See what your home could be worth and how the local market is moving.
Recent nearby sales
Sold prices are available to registered users. Log in to see what these sold for.
Monthly Cost Calculator
An estimate only. Canadian semi-annual compounding; excludes utilities, closing costs and BC property transfer tax. 5-year fixed, as of Aug 27
Similar Listings Nearby
6521 WALTHAM AVENUE
6555 ST. CHARLES PLACE
6096 SERVICE STREET
6030 ELGIN AVENUE
6166 DENBIGH AVENUE
6119 SERVICE STREET
6658 RANDOLPH AVENUE
6346 BURNS STREET
6818 GILLEY AVENUE
6091 SELMA AVENUE
6210 PEARL AVENUE
5990 IRMIN STREET