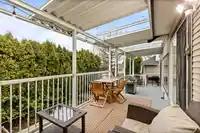
Set in the sought-after Harvest Wynd community, this Polygon-built residence has been beautifully reimagined for modern family living. Offering 5 bedrooms and 3 baths across ~2,900 sq ft, the home blends warmth, function and contemporary design. A stunning new kitchen anchors the main floor, complemented by updated bathrooms, new roof, air conditioning and…
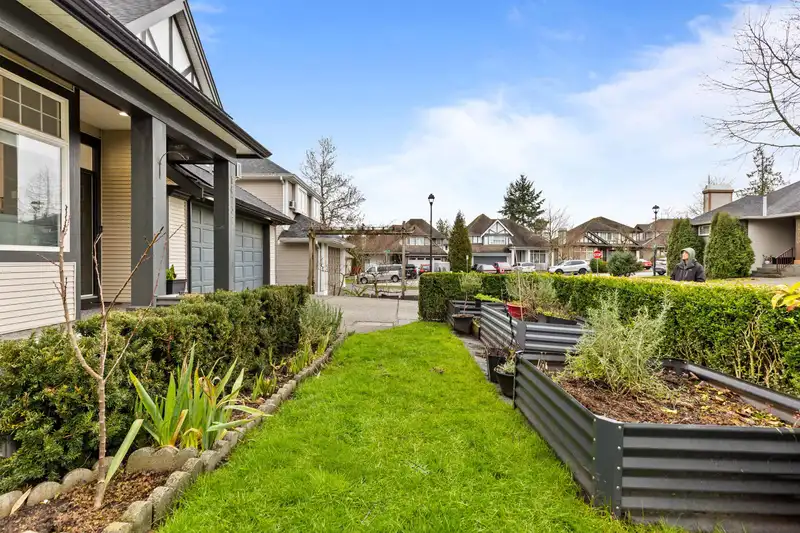
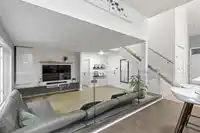
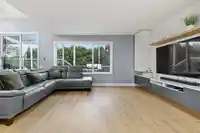
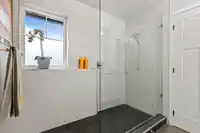
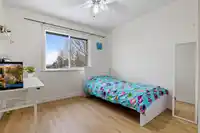
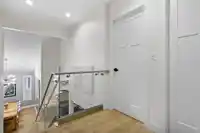
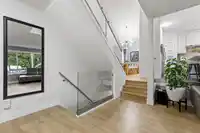
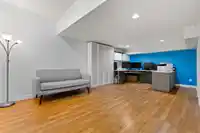
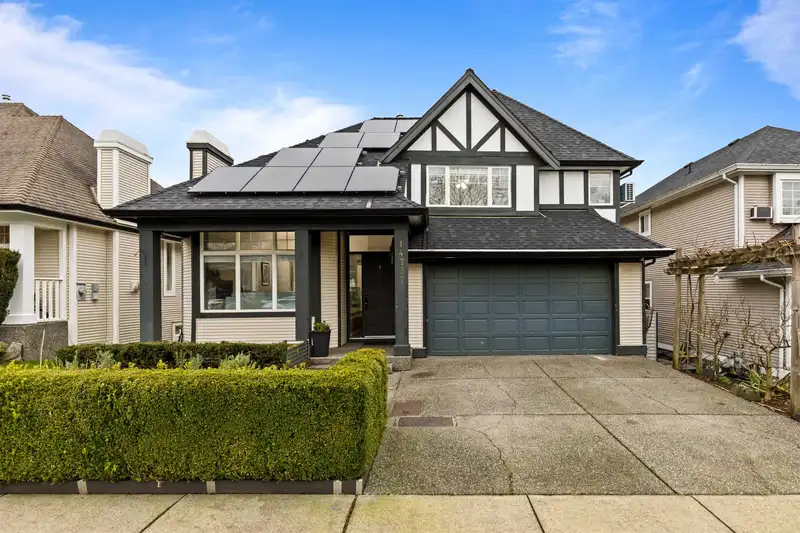
Set in the sought-after Harvest Wynd community, this Polygon-built residence has been beautifully reimagined for modern family living. Offering 5 bedrooms and 3 baths across ~2,900 sq ft, the home blends warmth, function and contemporary design. A stunning new kitchen anchors the main floor, complemented by updated bathrooms, new roof, air conditioning and covered patios that invite year-round enjoyment. Bright open living spaces, generous bedrooms and a versatile lower level provide room to grow, work and entertain. Solar panels dramatically offset energy costs—virtually net-zero with BC Hydro. Tucked on a quiet, family-friendly street near parks, transit and top catchment schools Chimney Hill Elementary & Frank Hurt Secondary, this is refined living done right. Call Now for more info!
Features
Balcony
Private Yard
Additional Parking
Garage Double
Front Access
Shopping Nearby
Room measurements16 rooms▸
FoyerMain · 7'11 × 5'4
Living RoomMain · 12'11 × 11'10
Dining RoomMain · 9'6 × 11'10
KitchenMain · 24'11 × 16'4
Living RoomMain · 18'11 × 14'11
LaundryMain · 9'10 × 5'10
BedroomAbove · 11'11 × 8'11
BedroomAbove · 11'11 × 10'2
Primary BedroomAbove · 15'2 × 11'3
Living RoomBelow · 25'7 × 11'10
BedroomBelow · 11'1 × 10'1
BedroomBelow · 11'1 × 20'9
StorageBelow · 6'8 × 27'1
StorageBelow · 11'11 × 6'0
PatioMain · 7'9 × 16'6
PatioMain · 7'9 × 19'3
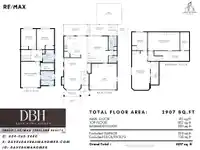
Floor plan
🔍 Tap to zoom
Pinch or scroll to zoom · drag to pan · double-tap to reset
Property Details
MLS NumberR3079517
Property TypeSingle Family Residence
Bedrooms5
Bathrooms3
Square Feet2,907
Lot Size3,914 sqft
Year Built1999
Parking Spaces2
HeatingElectric, Forced Air, Heat Pump
StatusClosed
Listed ByRE/MAX Treeland Realty
School Catchment
ElementaryChimney Hill
SecondaryFrank Hurt
Neighbourhood
Highlighted area = this home's census tract (StatCan), the boundary the neighbourhood stats describe.
$1,300,000Median home value
$126,000Median household income
70.3%Owner-occupied
36.6%Single-detached homes
3.8Avg household size
37.6Median age
28.6%Bachelor's degree or higher (25-64)
47.4%Commute under 30 min
83.2%Drive to work
49.6%Foreign-born residents
4,069Neighbourhood population
Age
Under 1516.2%
15 to 6469.9%
65 and over13.9%
Household size
1 person10.4%
218.9%
316.5%
422.6%
5 or more31.6%
Language spoken at home
42.4% Punjabi mother tongue
English30.8%
English + other9.3%
Hindi3.4%
Tagalog2.1%
Urdu1.5%
Vietnamese1.4%
All others9.1%
Mother tongue, share of 4,070 residents.
How this pocket differs
notably fewer people living alone than East Newton 10.4% vs 17.5%
more 5+ person households than East Newton 31.6% vs 25.1%
more 4-person households than East Newton 22.6% vs 18.7%
Median household income is higher than Metro Vancouver $126,000 vs $90,000
Median dwelling value is higher than Metro Vancouver $1,300,000 vs $1,050,000
Source: Statistics Canada, Census of Population, 2021. Reproduced and distributed on an "as is" basis with the permission of Statistics Canada.
Ped NaimiPersonal Real Estate Corp
Vinod BashirPersonal Real Estate Corp
Thinking of selling in East Newton?
See what your home could be worth and how the local market is moving.

 1 / 40 photos