
 1 / 26 photos
About This Property
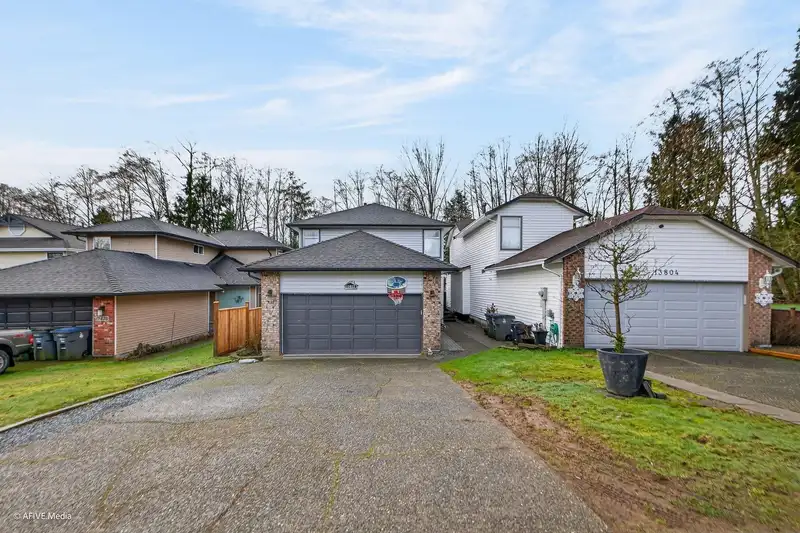
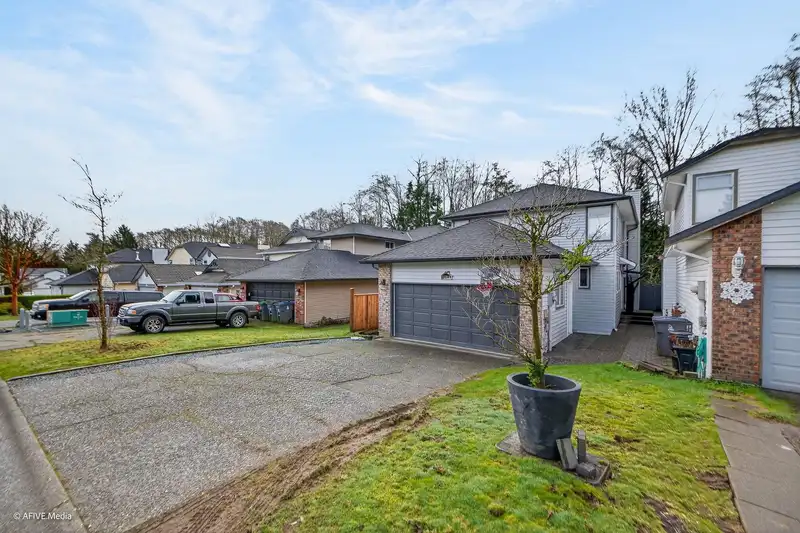
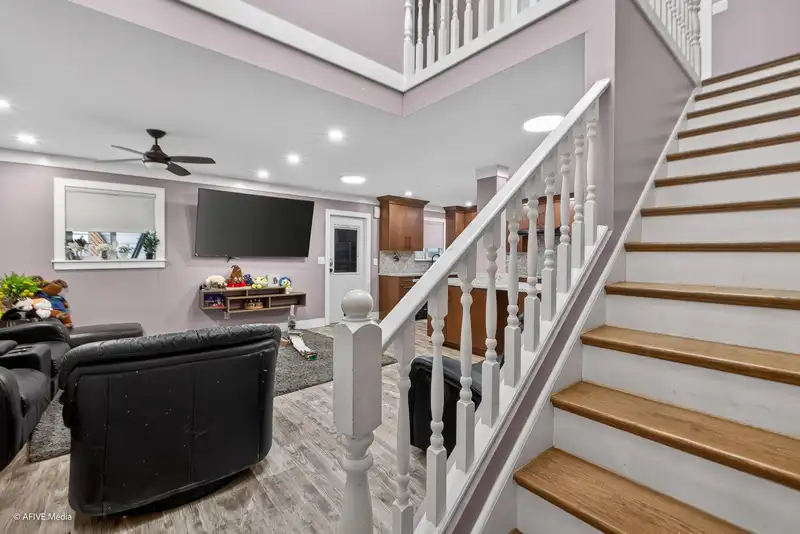
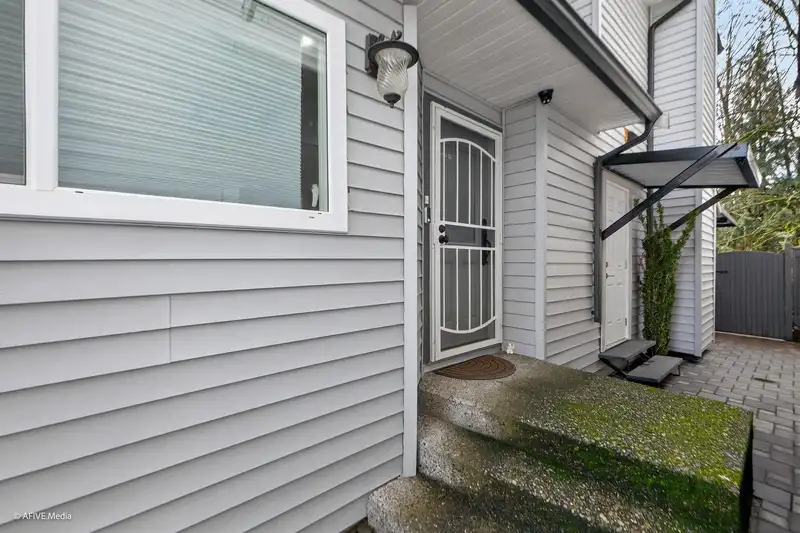
Beautiful Family House in a Quiet cul-de-sac, 4 bedrooms 3 Bathrooms, 1 bedroom (no closet) with new fully renovated. 1 Bedroom SUITE with separate entrance! Premium Vinyl Flooring, Built In Wall Oven, Open Floor Plan, Above 3 Spacious Bedrooms with 2 Washrooms + Big Bonus: Laundry on Above Level. Large New Outdoor Patio overlooking backing onto Green Space. Walking distance to Parks, Close to Transit, Schools, Shopping & Recreation Centre.
Features
Property Details
School Catchment
Neighbourhood
Age
- Under 1518.1%
- 15 to 6470.2%
- 65 and over11.8%
Household size
- 1 person12.1%
- 219.6%
- 319.6%
- 421.5%
- 5 or more27.2%
Language spoken at home
40.5% Punjabi mother tongue
Mother tongue, share of 5,955 residents.
How this pocket differs
- fewer people living alone than East Newton 12% vs 17.5%
Source: Statistics Canada, Census of Population, 2021. Reproduced and distributed on an "as is" basis with the permission of Statistics Canada.


Thinking of selling in East Newton?
See what your home could be worth and how the local market is moving.
Monthly Cost Calculator
Similar Listings Nearby
13840 65 AVENUE
6446 138 STREET
6418 137A STREET
13906 68 AVENUE
13747 63A AVENUE
6619 140 STREET
6280 137B STREET
6842 137A STREET
13791 62 AVENUE
14052 66 AVENUE
6445 KING GEORGE BOULEVARD
6421 KING GEORGE BOULEVARD