
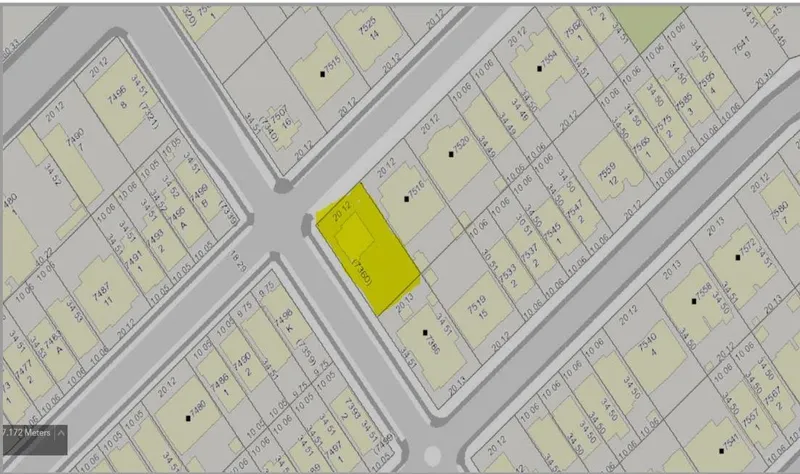
 1 / 11 photos
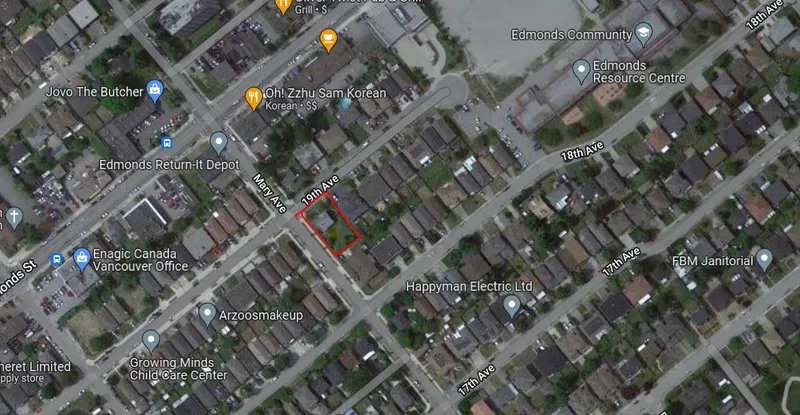
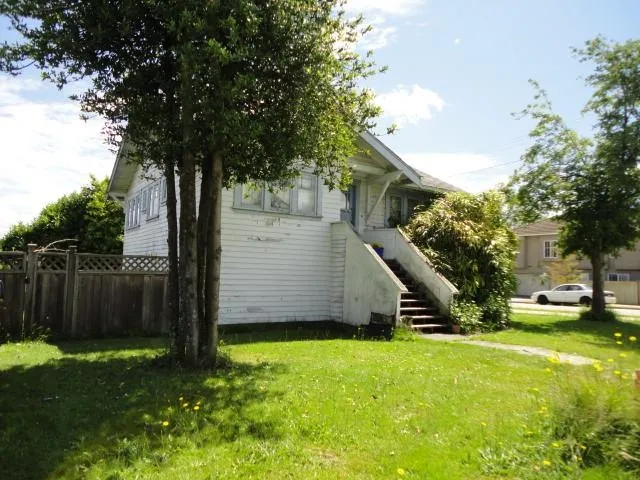
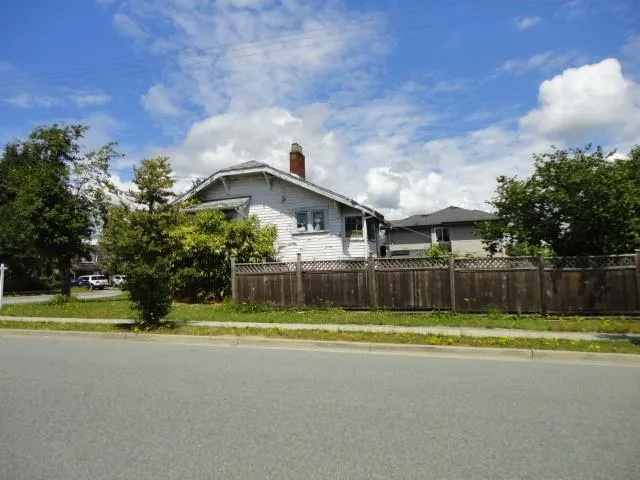


About This Property
BUILDER & INVESTOR OPPORTUNITY! Prime corner lot at Mary & 19th in a highly desirable neighborhood. Conveniently located near schools, transit, and shopping. New zoning permits up to six units (buyer to verify with the City of Burnaby). Don’t miss this rare development potential in a sought-after area. Contact us today for more details!

Thinking of selling in Edmonds BE?
See what your home could be worth and how the local market is moving.
Features
Property Details
School Catchment
Neighbourhood
Age
- Under 1514.8%
- 15 to 6473.7%
- 65 and over11.4%
Household size
- 1 person28.7%
- 231.6%
- 316%
- 413.3%
- 5 or more10.4%
Language spoken at home
28.6% English mother tongue
Mother tongue, share of 6,095 residents.
How this pocket differs
- fewer seniors 65+ than Burnaby East 11.4% vs 16.2%
- more people living alone than Burnaby East 28.8% vs 21.5%
- fewer 4-person households than Burnaby East 13.3% vs 16.8%
- notably fewer Punjabi speakers than Burnaby East 3% vs 5.1%
- more Tagalog speakers than Burnaby East 7.8% vs 5.7%
Source: Statistics Canada, Census of Population, 2021. Reproduced and distributed on an "as is" basis with the permission of Statistics Canada.
Recent nearby sales
Sold prices are available to registered users. Log in to see what these sold for.
Monthly Cost Calculator
An estimate only. Canadian semi-annual compounding; excludes utilities, closing costs and BC property transfer tax. 5-year fixed, as of Nov 2
Similar Listings Nearby
7474 EDMONDS STREET
7728 ROSEWOOD STREET
7487 ROSEWOOD STREET
7336 16TH AVENUE
7535 BURGESS STREET
7814 ROSEWOOD STREET
7525 13TH AVENUE
7280 15TH AVENUE
7620 14TH AVENUE
6693 CANADA WAY
7865 ROSEWOOD STREET
7868 ELWELL STREET