
 1 / 21 photos


About This Property
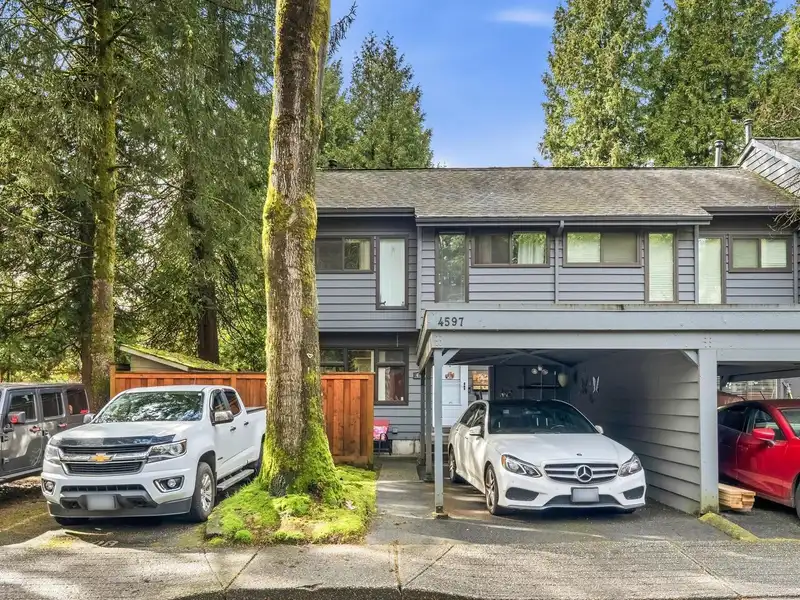
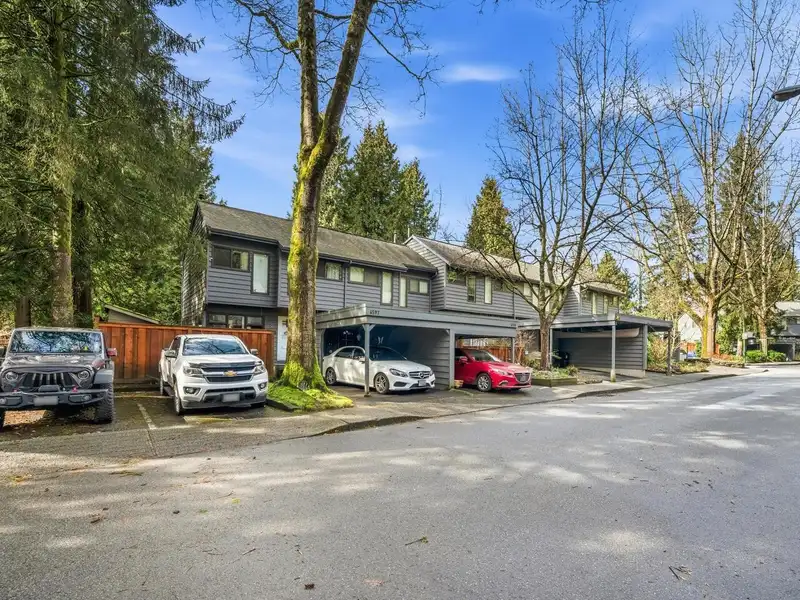
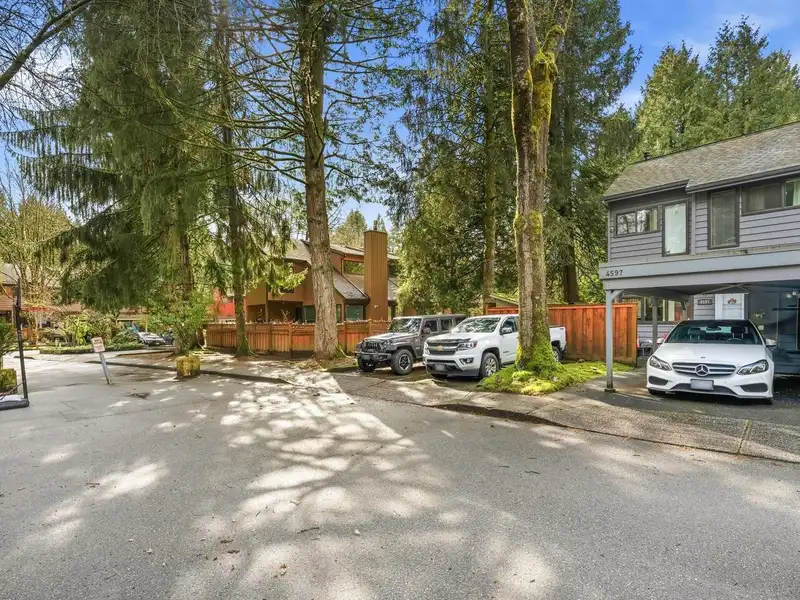
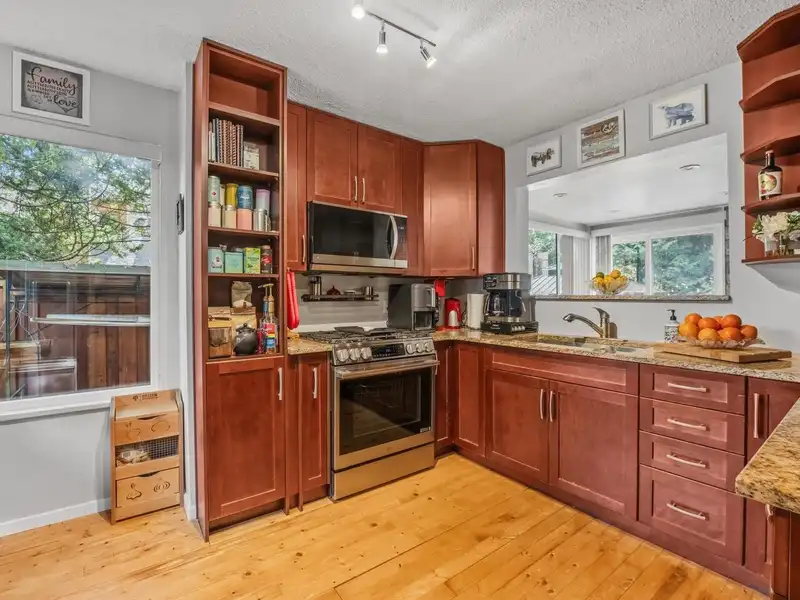
Rarely Offered! A Prime Corner Unit Townhome with the BEST LOCATION! This Beautifully Maintained 3 Bed & 3 Bath, Unit offers Ample Space for your Growing Family. Enjoy entertaining on the main level that features Large Windows and includes a Living Room, Dining Room, Kitchen & Gas Fireplace! An Abundance of Nature surrounds the Property that creates a…

Thinking of selling in Greentree Village?
See what your home could be worth and how the local market is moving.
Features
Property Details
School Catchment
Neighbourhood
Age
- Under 1514%
- 15 to 6465%
- 65 and over21%
Household size
- 1 person18.8%
- 232.6%
- 318.8%
- 419%
- 5 or more10.9%
Language spoken at home
52.3% English mother tongue
Mother tongue, share of 5,335 residents.
How this pocket differs
- notably fewer people living alone than Burnaby South 18.8% vs 30.4%
- notably more 4-person households than Burnaby South 19% vs 12.3%
- more 5+ person households than Burnaby South 10.9% vs 7.7%
- notably fewer Cantonese speakers than Burnaby South 6.6% vs 11.4%
- notably fewer Mandarin speakers than Burnaby South 11.4% vs 17.4%
- Median household income is higher than Metro Vancouver $115,000 vs $90,000
Source: Statistics Canada, Census of Population, 2021. Reproduced and distributed on an "as is" basis with the permission of Statistics Canada.
Recent nearby sales
Sold prices are available to registered users. Log in to see what these sold for.
Monthly Cost Calculator
An estimate only. Canadian semi-annual compounding; excludes utilities, closing costs and BC property transfer tax. 5-year fixed, as of Nov 18
Similar Listings Nearby
4384 GARDEN GROVE DRIVE
4212 GARDEN GROVE DRIVE
4735 WILLOWDALE PLACE
4 4561 CHARLOTTE COURT
2 4561 CHARLOTTE COURT
3 4561 CHARLOTTE COURT
1 4561 CHARLOTTE COURT
5 4561 CHARLOTTE COURT
6 5399 WOODSWORTH STREET
5 5399 WOODSWORTH STREET
4 5399 WOODSWORTH STREET
4715 4711 HAZEL STREET