
 1 / 30 photos


About This Property
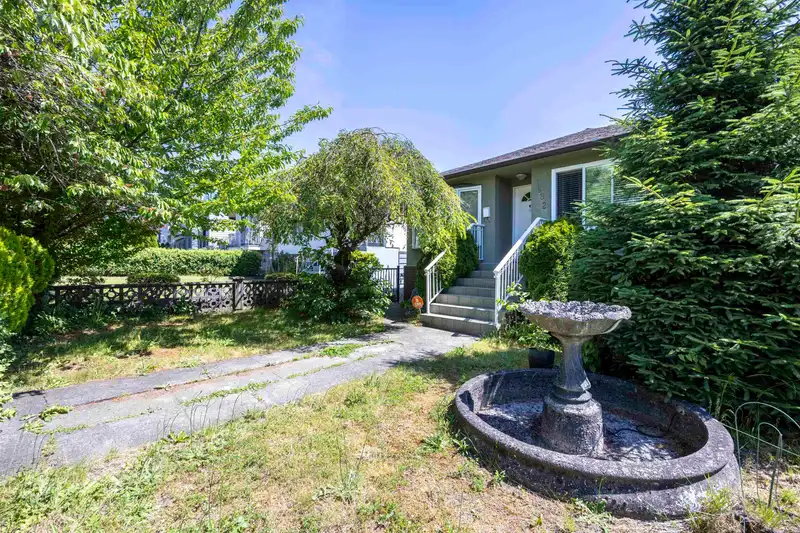
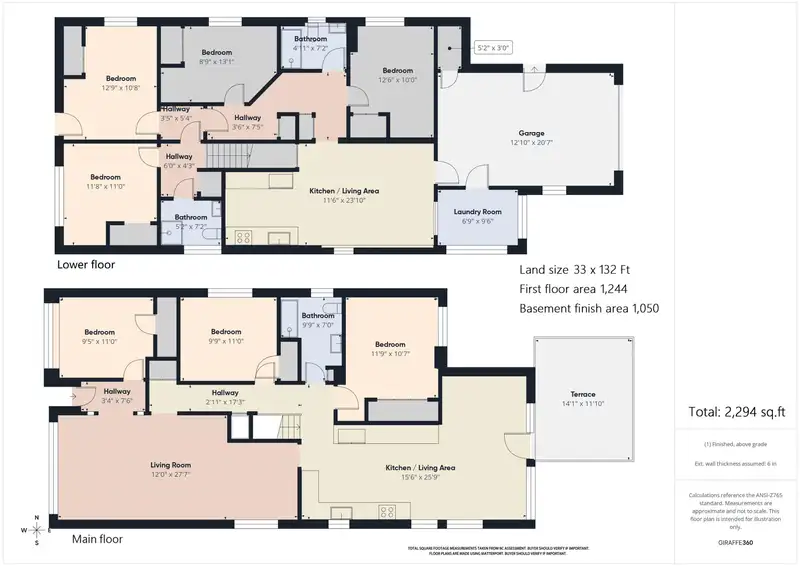
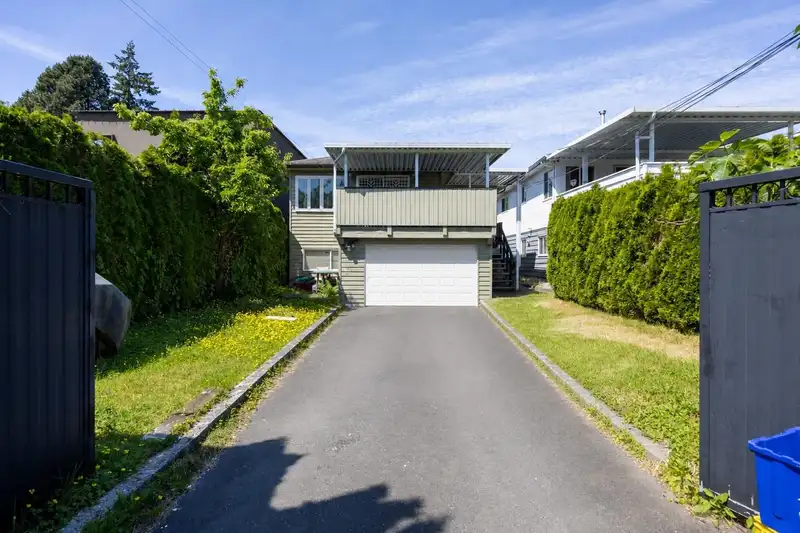
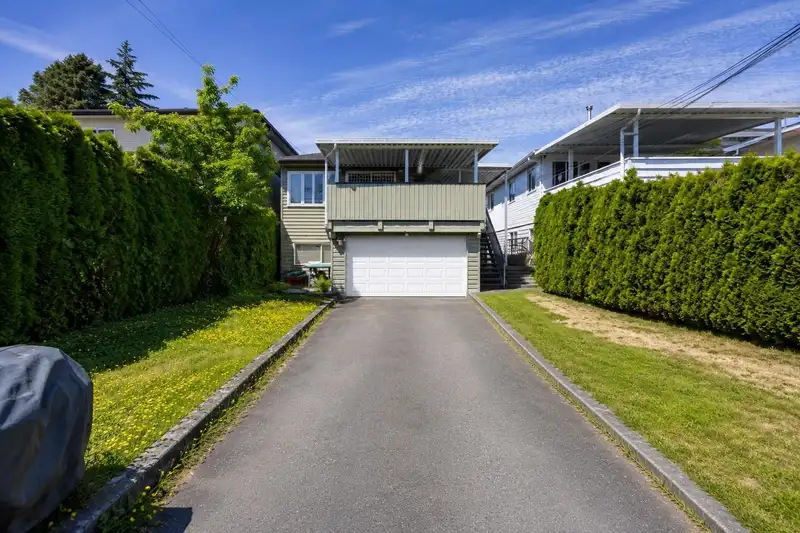
33X132 Lot size, Upstairs with three bedrooms plus two bedroom in the basement are rented. Two bedrooms suite in the basement is just renovated in 2026 great mortgage helper. Convenient location in South Granville, easy access to Richmond, Yolk House, Churchill High School, and Laurier Elementary School. Open house : 2:00-4:00 PM, Sunday, Nov.15,2026

Thinking of selling in South Granville?
See what your home could be worth and how the local market is moving.
Features
Property Details
School Catchment
Neighbourhood
Age
- Under 1514.2%
- 15 to 6467.7%
- 65 and over18.1%
Household size
- 1 person22.4%
- 229.2%
- 320.8%
- 417.8%
- 5 or more9.7%
Language spoken at home
31% English mother tongue
Mother tongue, share of 4,995 residents.
How this pocket differs
- more children under 15 than Marpole 14.2% vs 10.7%
- notably more 4-person households than Marpole 17.9% vs 10%
- notably fewer people living alone than Marpole 22.5% vs 39.4%
- notably more 5+ person households than Marpole 9.8% vs 5.9%
- notably fewer Tagalog speakers than Marpole 3% vs 4.6%
- more Cantonese speakers than Marpole 22.9% vs 16.4%
- Median dwelling value is notably higher than Metro Vancouver $2,000,000 vs $1,050,000
Source: Statistics Canada, Census of Population, 2021. Reproduced and distributed on an "as is" basis with the permission of Statistics Canada.
Recent nearby sales
Sold prices are available to registered users. Log in to see what these sold for.
Monthly Cost Calculator
An estimate only. Canadian semi-annual compounding; excludes utilities, closing costs and BC property transfer tax. 5-year fixed, as of Nov 5
Similar Listings Nearby
7687 OAK STREET
1275 PARK DRIVE
970 W 64TH AVENUE
8110 OSLER STREET
922 PARK DRIVE
7658 FREMLIN STREET
5 1311 W 57TH AVENUE
8205 HUDSON STREET
7225 HUDSON STREET
LOT A 7225 HUDSON STREET
1373 W 64TH AVENUE
817 W 64TH AVENUE