
 1 / 20 photos
About This Property
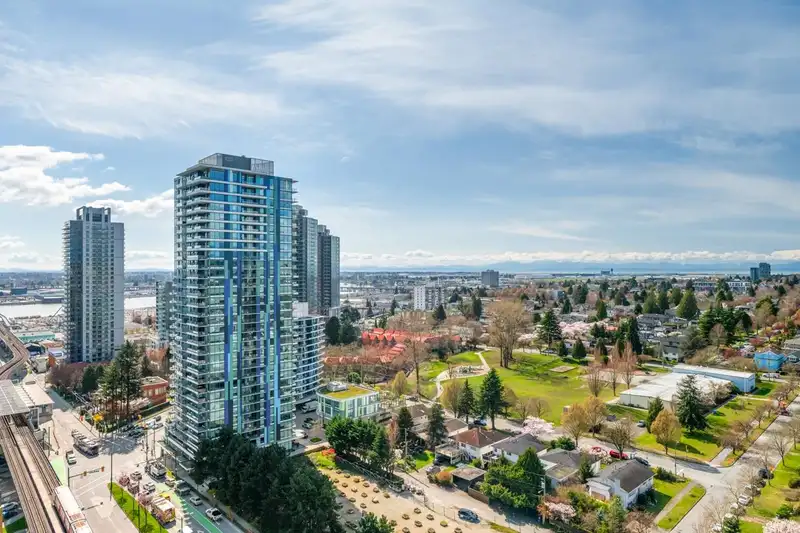
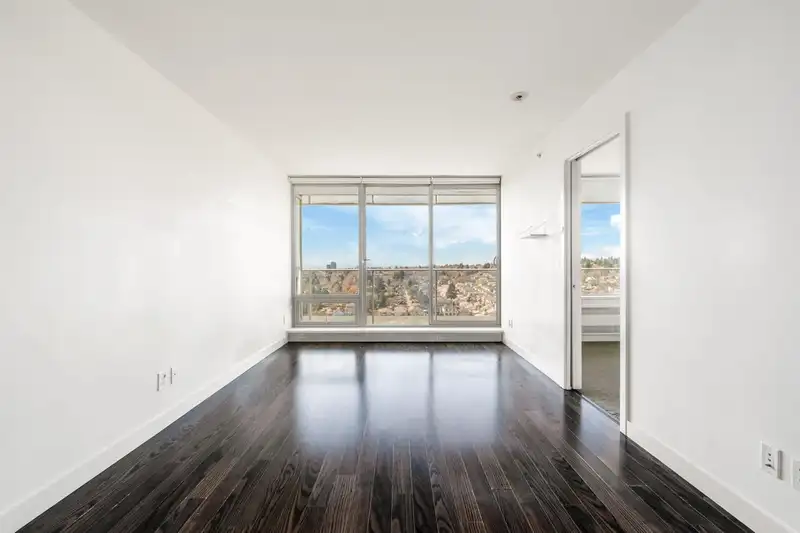
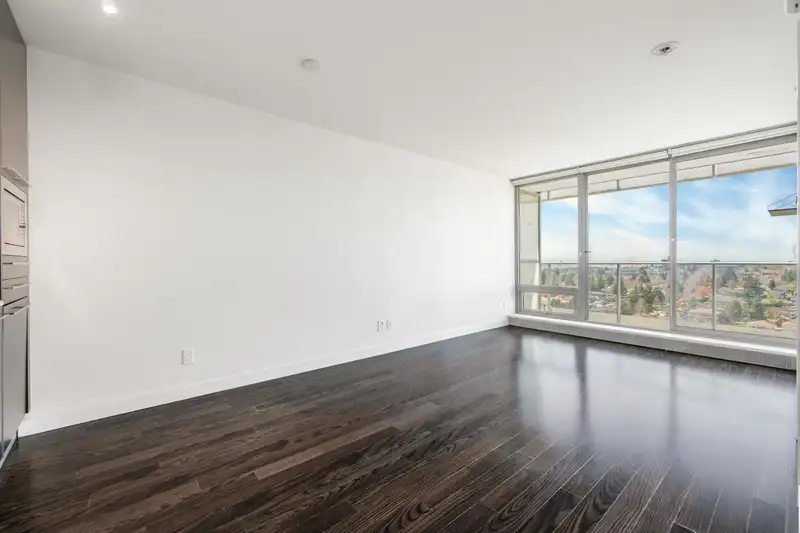
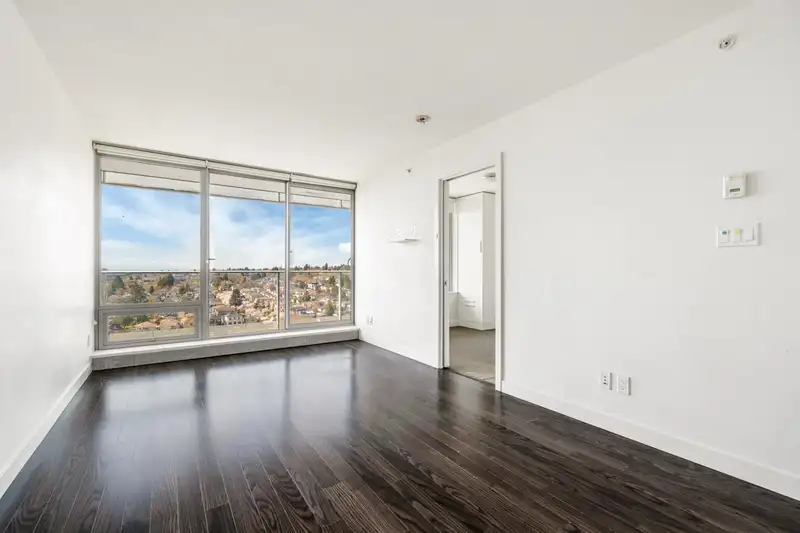
Welcome to MC2 by Intracorp! This 1 Bed + 1 Bath suite located in the North Tower offers STUNNING 270 Degree views spanning from the North Shore Mountains to the Gulf Islands, floor-to-ceiling windows for plenty of natural lighting, an open concept floor plan with energy efficient heating/cooling system & a 22'1" x 4'1" balcony! Modern kitchen features stainless steel Bloomberg appliances, Caesarstone countertops & Grohe plumbing fixtures. Enjoy in-building amenities including concierge, fitness centre, meeting rooms & BBQ area. AMAZING LOCATION just steps to the Canada Line, T&T Supermarket, Cineplex theatre, and your choice of restaurants and cafes in the Marine Gateway complex. 1 parking & 1 Storage Locker included.
Features
Property Details
School Catchment
Neighbourhood
Age
- Under 1510%
- 15 to 6473.4%
- 65 and over16.6%
Household size
- 1 person36.2%
- 234.2%
- 313.8%
- 49.7%
- 5 or more6.2%
Language spoken at home
27.6% English mother tongue
Mother tongue, share of 6,930 residents.
How this pocket differs
- notably more Punjabi speakers than Marpole 3.1% vs 1.6%
- notably more Korean speakers than Marpole 3% vs 1.7%
- more Mandarin speakers than Marpole 19.8% vs 15.6%
- more Cantonese speakers than Marpole 20.1% vs 16.4%
- Median household income is lower than Metro Vancouver $69,500 vs $90,000
- Median dwelling value is higher than Metro Vancouver $1,340,000 vs $1,050,000
Source: Statistics Canada, Census of Population, 2021. Reproduced and distributed on an "as is" basis with the permission of Statistics Canada.


Thinking of selling in Marpole?
See what your home could be worth and how the local market is moving.
Monthly Cost Calculator
Similar Listings Nearby
1706 8031 NUNAVUT LANE
2406 8031 NUNAVUT LANE
606 8031 NUNAVUT LANE
804 8031 NUNAVUT LANE
901 8131 NUNAVUT LANE
2504 8131 NUNAVUT LANE
3104 8131 NUNAVUT LANE
3204 8131 NUNAVUT LANE
1508 8131 NUNAVUT LANE
2401 8131 NUNAVUT LANE
1502 8131 NUNAVUT LANE
804 8131 NUNAVUT LANE