
 1 / 22 photos


About This Property
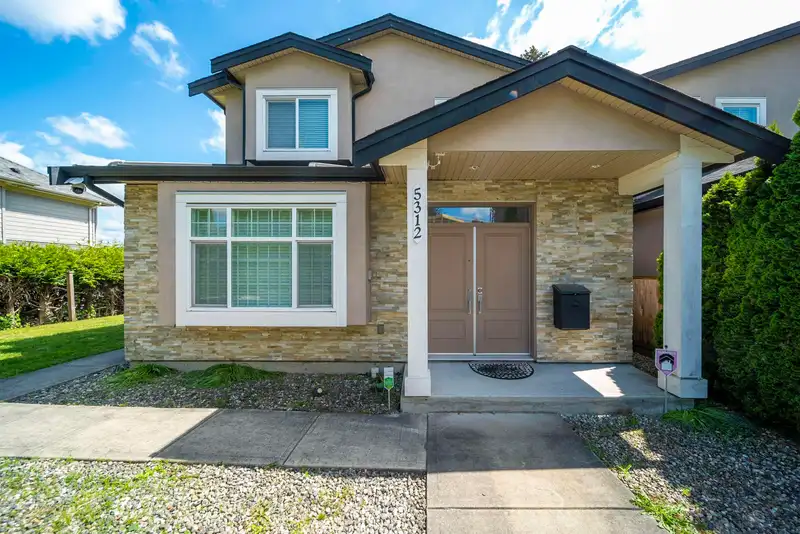
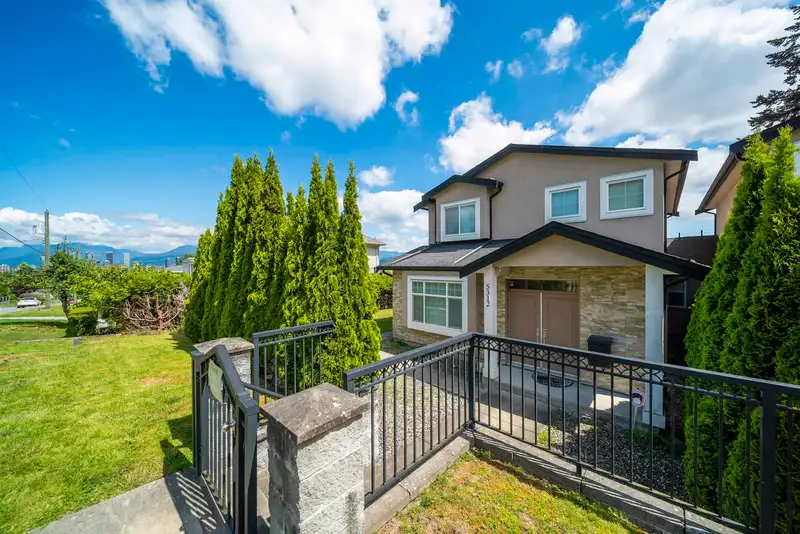
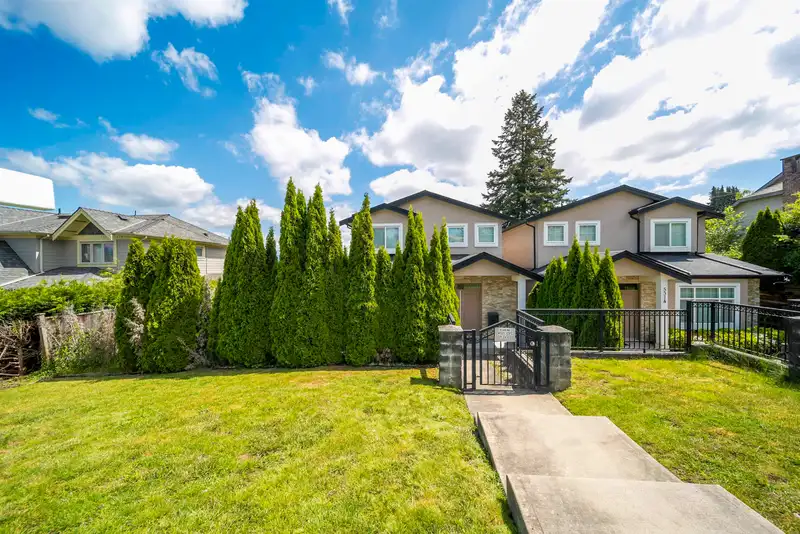
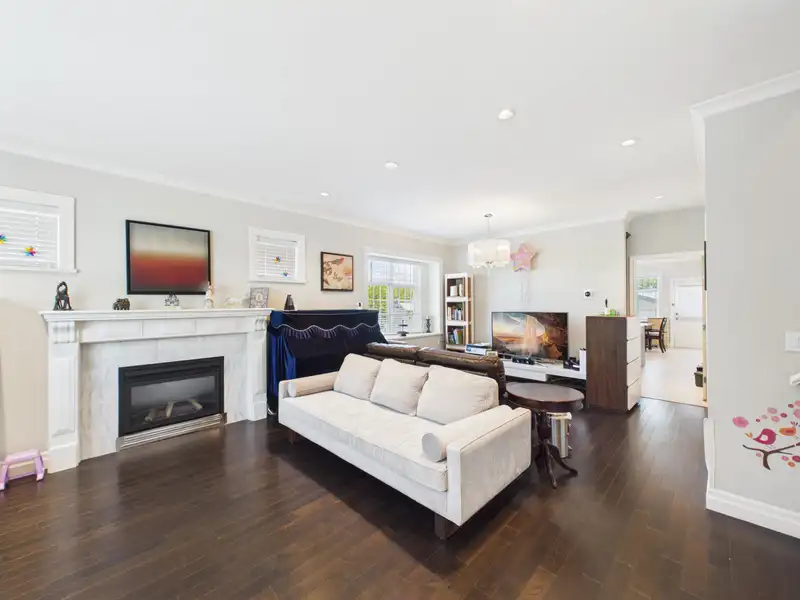
This elegant 4-bedroom, 4-bathroom 2 level 1/2 duplex home located in a very central location to everything. It offers a perfect blend of modern comfort, style, and privacy. Featuring a beautiful contemporary exterior with stone accents, large windows, and a welcoming covered entrance, the property creates a strong first impression. The spacious layout is…

Thinking of selling in Forest Glen BS?
See what your home could be worth and how the local market is moving.
Features
Property Details
School Catchment
Neighbourhood
Age
- Under 1510.8%
- 15 to 6468.8%
- 65 and over20.5%
Household size
- 1 person21.2%
- 232.4%
- 317.3%
- 417.6%
- 5 or more11.5%
Language spoken at home
33.4% English mother tongue
Mother tongue, share of 3,785 residents.
How this pocket differs
- notably more 5+ person households than Burnaby South 11.6% vs 7.7%
- more 4-person households than Burnaby South 17.7% vs 12.3%
- fewer people living alone than Burnaby South 21.3% vs 30.4%
- more Punjabi speakers than Burnaby South 3% vs 2.3%
- more Mandarin speakers than Burnaby South 21.4% vs 17.4%
- Median dwelling value is notably higher than Metro Vancouver $1,800,000 vs $1,050,000
Source: Statistics Canada, Census of Population, 2021. Reproduced and distributed on an "as is" basis with the permission of Statistics Canada.
Monthly Cost Calculator
An estimate only. Canadian semi-annual compounding; excludes utilities, closing costs and BC property transfer tax. 5-year fixed, as of Nov 3
Similar Listings Nearby
4675 BUXTON COURT
4513 ELLERTON COURT
4591 GRASSMERE STREET
1 5459 FORGLEN DRIVE
6870 FREDERICK AVENUE
4986 INMAN AVENUE
6272 ROYAL OAK AVENUE
4316 HURST STREET
5464 OAKLAND STREET
4364 GRETA STREET
4324 GRETA STREET
3 7337 DOW AVENUE