
 1 / 40 photos


About This Property
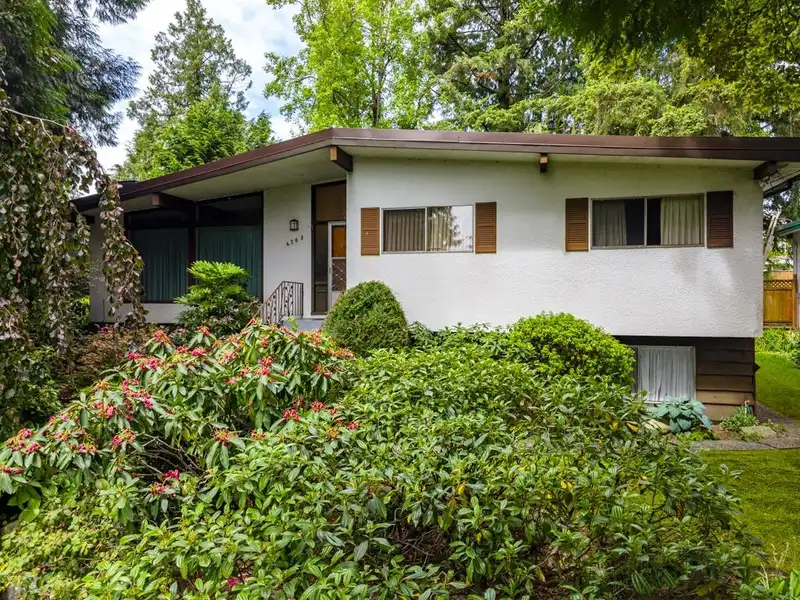
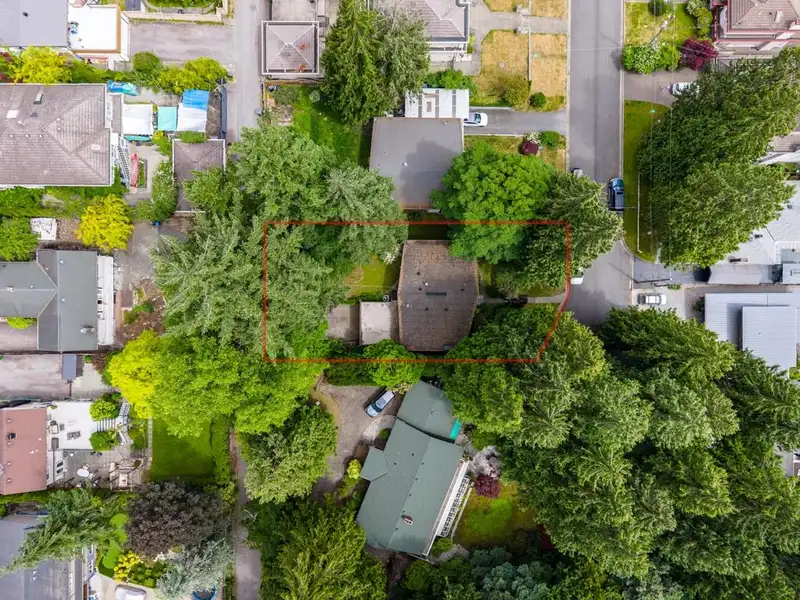
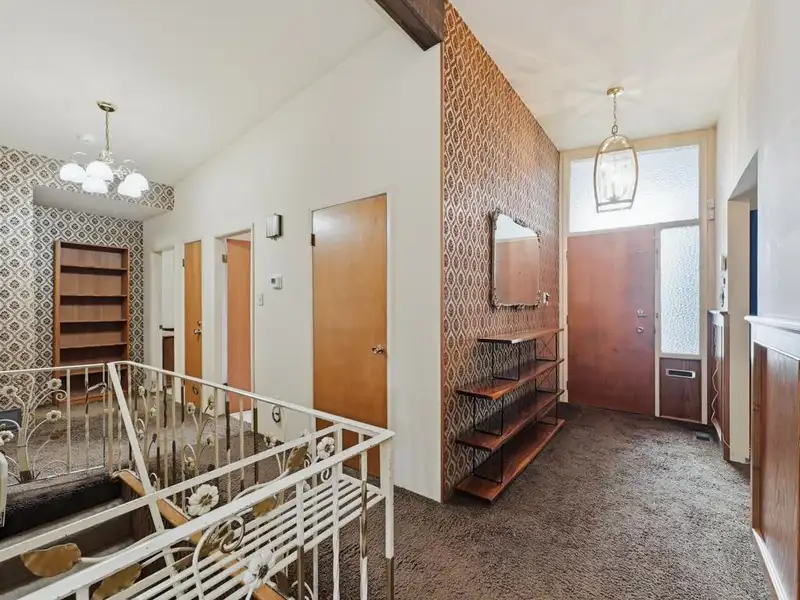
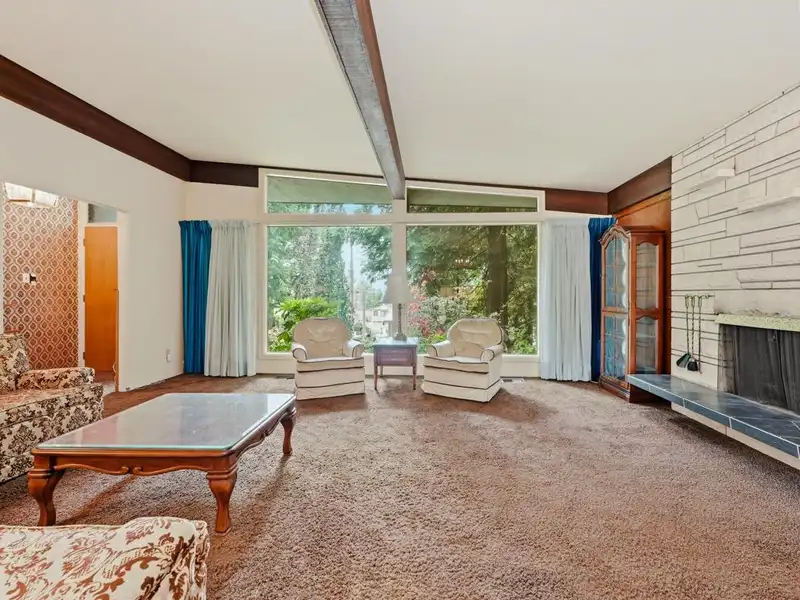
South-facing private & quiet property situated at the end of a cul-de-sac with 66' frontage & back lane! 20 meters from Gray Creek Ravine Park = greenbelt across the street! 3 bedrooms up & primary has powder ensuite. Spacious living room. Kitchen is open to separate & large eating area that walks out to huge 21'5 x 20'10 sundeck! Furnace replaced 2022; 10…

Thinking of selling in South Slope?
See what your home could be worth and how the local market is moving.
Features
Property Details
School Catchment
Neighbourhood
Age
- Under 1512.9%
- 15 to 6468.3%
- 65 and over18.8%
Household size
- 1 person19%
- 232.3%
- 317.1%
- 417.9%
- 5 or more13.7%
Language spoken at home
41.6% English mother tongue
Mother tongue, share of 3,760 residents.
How this pocket differs
- notably more 5+ person households than Burnaby South 13.7% vs 7.7%
- notably fewer people living alone than Burnaby South 19% vs 30.4%
- more 4-person households than Burnaby South 17.9% vs 12.3%
- notably more Punjabi speakers than Burnaby South 4.5% vs 2.3%
- Median dwelling value is notably higher than Metro Vancouver $1,640,000 vs $1,050,000
Source: Statistics Canada, Census of Population, 2021. Reproduced and distributed on an "as is" basis with the permission of Statistics Canada.
Sales History
| Date | Sale Price |
|---|---|
| Jul 3, 2026 | $1,738,500 |
Source: BC Assessment (public records).
Recent nearby sales
Sold prices are available to registered users. Log in to see what these sold for.
Monthly Cost Calculator
An estimate only. Canadian semi-annual compounding; excludes utilities, closing costs and BC property transfer tax. 5-year fixed, as of Nov 12
Similar Listings Nearby
4922 IRMIN STREET
4940 RUMBLE STREET
7438 NELSON AVENUE
7629 ARTHUR AVENUE
4939 SIDLEY STREET
7188 GRAY AVENUE
7707 MCGREGOR AVENUE
8061 MCGREGOR AVENUE
5091 SIDLEY STREET
4505 MARINE DRIVE
5039 MARINE DRIVE
4479 MARINE DRIVE