
 1 / 33 photos









About This Property
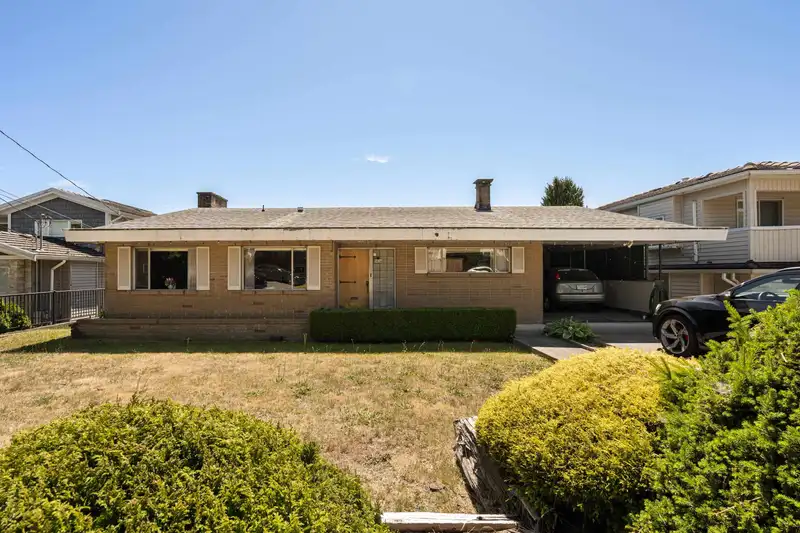
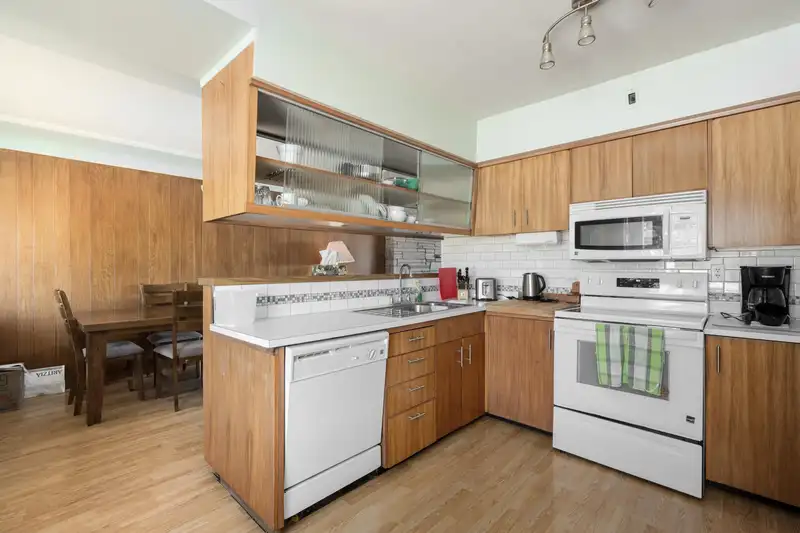
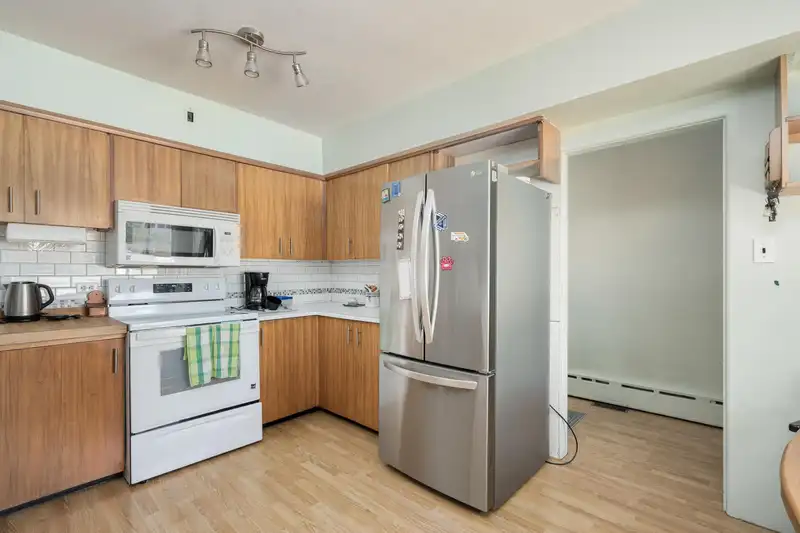
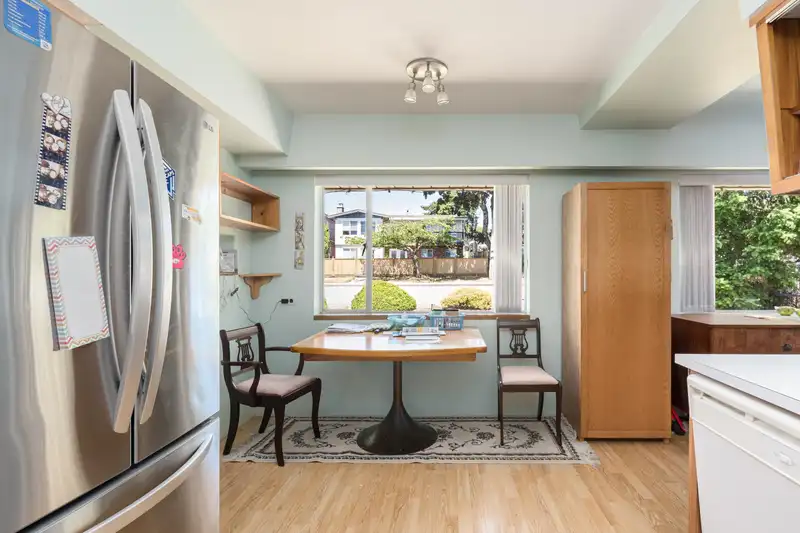
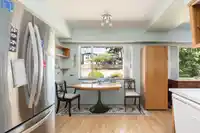
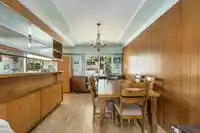
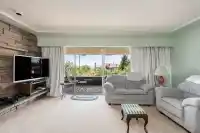
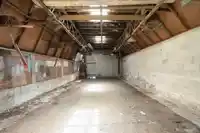
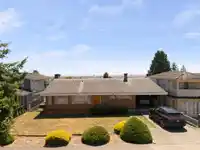
BUILDERS AND FAMILIES ALERT! Fantastic opportunity in Burnaby's highly sought-after South Slope neighborhood. Situated on a gently sloping lot with a sunny south-facing backyard and expansive views, this property offers tremendous potential. The existing home features 3 bedrooms and 2 full bathrooms upstairs and is currently livable, but requires…
Features
Property Details
School Catchment
Neighbourhood
Age
- Under 1514%
- 15 to 6470.5%
- 65 and over15.5%
Household size
- 1 person23.5%
- 229.9%
- 320.4%
- 415.6%
- 5 or more10.6%
Language spoken at home
34.8% English mother tongue
Mother tongue, share of 7,505 residents.
How this pocket differs
- more children under 15 than Metrotown 14% vs 11%
- notably more 5+ person households than Metrotown 10.7% vs 4.6%
- notably more 4-person households than Metrotown 15.6% vs 9.2%
- fewer people living alone than Metrotown 23.6% vs 34.9%
- notably more Punjabi speakers than Metrotown 3.5% vs 1.6%
- more Cantonese speakers than Metrotown 14.4% vs 11.3%
Source: Statistics Canada, Census of Population, 2021. Reproduced and distributed on an "as is" basis with the permission of Statistics Canada.


Thinking of selling in South Slope?
See what your home could be worth and how the local market is moving.
Recent nearby sales
Sold prices are available to registered users. Log in to see what these sold for.
Monthly Cost Calculator
An estimate only. Canadian semi-annual compounding; excludes utilities, closing costs and BC property transfer tax. 5-year fixed, as of Aug 19
Similar Listings Nearby
5463 PORTLAND STREET
5343 NEVILLE STREET
4638 ROYAL OAK AVENUE
7758 MCGREGOR AVENUE
8326 ROYAL OAK AVENUE
5105 MCKEE STREET
5529 KEITH STREET
8061 MCGREGOR AVENUE
8543 ROYAL OAK AVENUE
5058 CARSON STREET
5135 MARINE DRIVE
5091 SIDLEY STREET