
 1 / 19 photos







About This Property
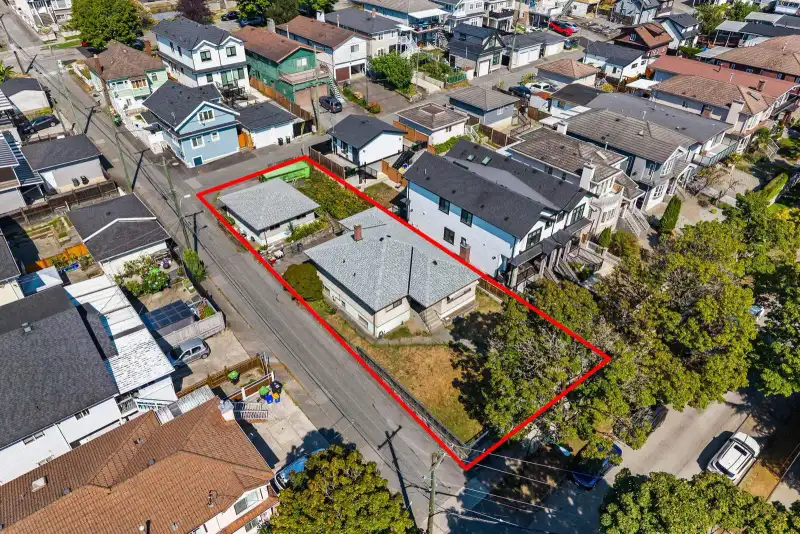
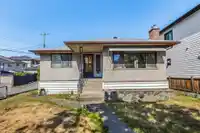
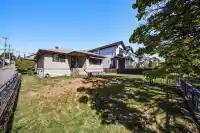
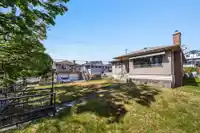
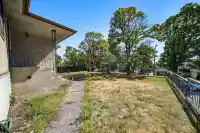
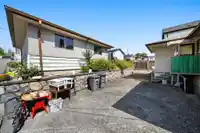
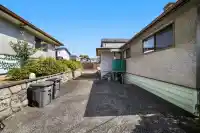
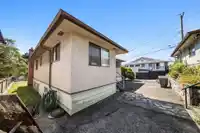
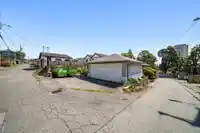
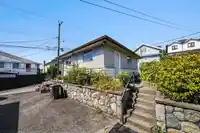
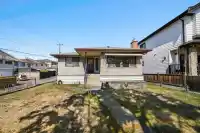
Welcome to this well maintained home on a desirable corner lot, offering exceptional development potential in a sought-after location. A compelling opportunity for builders, investors, and future b.omeowners, with the property offering excellent possibilities for redevelopment or long-term investment. Conveniently located close to schools, parks, shopping,…
Features
Property Details
School Catchment
Neighbourhood
Age
- Under 1512.8%
- 15 to 6471%
- 65 and over16.2%
Household size
- 1 person19.1%
- 222.4%
- 319.1%
- 418.4%
- 5 or more21%
Language spoken at home
25.5% Punjabi mother tongue
Mother tongue, share of 4,420 residents.
How this pocket differs
- fewer Cantonese speakers than South Vancouver 9.2% vs 13.5%
- more Tagalog speakers than South Vancouver 10.3% vs 8.2%
- more Punjabi speakers than South Vancouver 25.5% vs 20.4%
- Median dwelling value is notably higher than Metro Vancouver $1,600,000 vs $1,050,000
Source: Statistics Canada, Census of Population, 2021. Reproduced and distributed on an "as is" basis with the permission of Statistics Canada.


Thinking of selling in South Vancouver?
See what your home could be worth and how the local market is moving.
Recent nearby sales
Sold prices are available to registered users. Log in to see what these sold for.
Monthly Cost Calculator
An estimate only. Canadian semi-annual compounding; excludes utilities, closing costs and BC property transfer tax. 5-year fixed, as of Oct 1
Similar Listings Nearby
707 E 63RD AVENUE
748 E 62ND AVENUE
638 E 61ST AVENUE
648 E 65TH AVENUE
586 E 60TH AVENUE
7429 FRASER STREET
919 E 64TH AVENUE
742 E 58TH AVENUE
768 E 58TH AVENUE
966 E 64TH AVENUE
7882 WINDSOR STREET
475 SE MARINE DRIVE