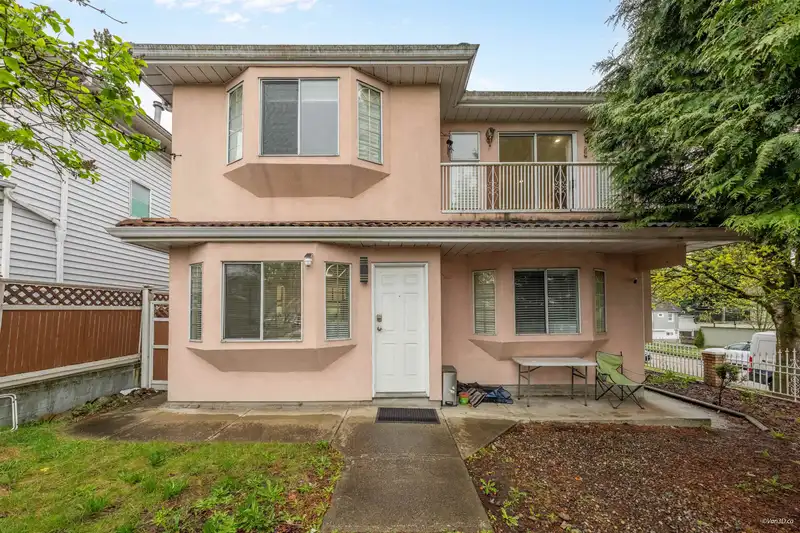
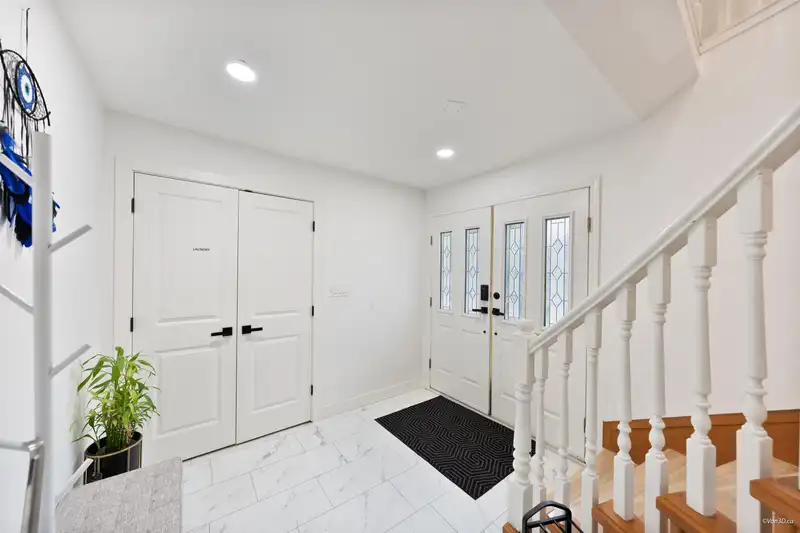
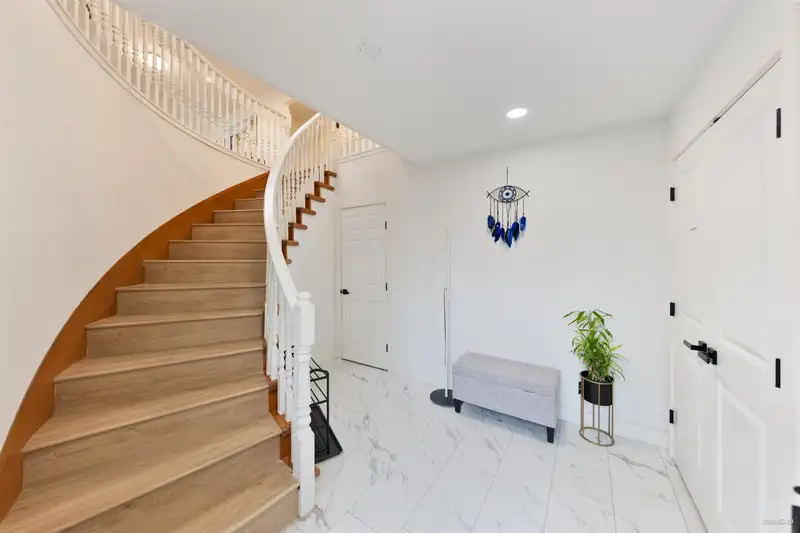
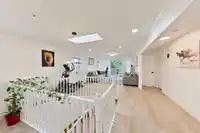
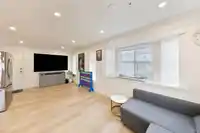
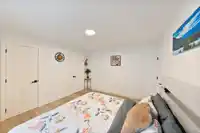
Great Investment opportunity with an upgraded corner-lot home in East Van! This spacious 8-bed 5-bath house sits on a 4,395 sqft lot, features 3 self-contained rental suites & Airbnb upstairs, offering excellent mortgage helpers with great rental income. In 2024, the home was upgraded with over $100k with new stainless steel appliances, laminated flooring,…
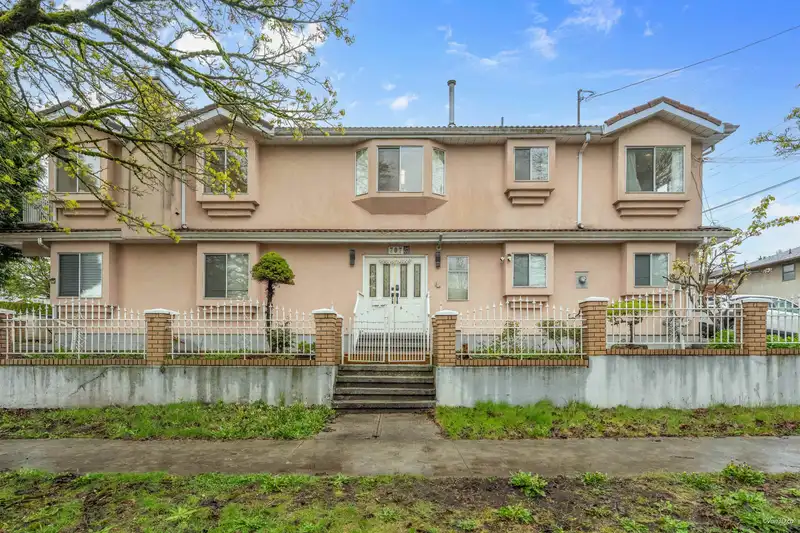
Great Investment opportunity with an upgraded corner-lot home in East Van! This spacious 8-bed 5-bath house sits on a 4,395 sqft lot, features 3 self-contained rental suites & Airbnb upstairs, offering excellent mortgage helpers with great rental income. In 2024, the home was upgraded with over $100k with new stainless steel appliances, laminated flooring, a high-efficiency on-demand hot water system, radiant heating ensuring comfort thru out the house. Ideal for families and investors, this 3-sided property with back lane access, provides flexibility, modern living and high income potential in one of Vancouver East best neighbourhood. Centrally located, near amenities, transit, and mins from YVR , it's a move-in-ready investment you don’t want to miss!
Features
Carport Multiple
Lane Access
Shopping Nearby
Room measurements20 rooms▸
Living RoomMain · 13'9 × 25'3
Dining RoomMain · 14'6 × 9'6
KitchenMain · 13'6 × 10'11
Family RoomMain · 22'1 × 10'4
LaundryMain · 5'1 × 12'2
Primary BedroomMain · 13'5 × 11'7
BedroomMain · 10'1 × 10'2
BedroomMain · 13'5 × 11'9
FoyerBelow · 9'5 × 10'4
LaundryBelow · 9'5 × 3'10
KitchenBelow · 10'5 × 7'10
BedroomBelow · 11' × 17'1
BedroomBelow · 7'1 × 8'8
KitchenBelow · 16'7 × 4'10
Living RoomBelow · 16'7 × 6'4
BedroomBelow · 13'4 × 8'11
KitchenBelow · 13'5 × 5'
Living RoomBelow · 13'5 × 10'2
BedroomBelow · 11'4 × 10'2
BedroomBelow · 13'6 × 8'6
Floor plan
🔍 Tap to zoom
Pinch or scroll to zoom · drag to pan · double-tap to reset
Property Details
MLS NumberR3112489
Property TypeSingle Family Residence
Bedrooms8
Bathrooms5
Square Feet3,333
Lot Size4,395 sqft
Year Built1995
HeatingBaseboard, Radiant
Days on Market134
StatusActive
Listed ByRE/MAX City Realty
School Catchment
ElementaryMoberly
SecondaryJohn Oliver
Neighbourhood
Highlighted area = this home's census tract (StatCan), the boundary the neighbourhood stats describe.
$1,600,000Median home value
$91,000Median household income
47.6%Owner-occupied
17.5%Single-detached homes
3.2Avg household size
37.2Median age
34.7%Bachelor's degree or higher (25-64)
55.1%Commute under 30 min
61.9%Drive to work
58.4%Foreign-born residents
4,519Neighbourhood population
Age
Under 1512.8%
15 to 6471%
65 and over16.2%
Household size
1 person19.1%
222.4%
319.1%
418.4%
5 or more21%
Language spoken at home
25.5% Punjabi mother tongue
English24.2%
Tagalog10.3%
Cantonese9.2%
English + other8.7%
Hindi2.8%
Vietnamese2.8%
All others16.5%
Mother tongue, share of 4,420 residents.
How this pocket differs
fewer Cantonese speakers than South Vancouver 9.2% vs 13.5%
more Tagalog speakers than South Vancouver 10.3% vs 8.2%
more Punjabi speakers than South Vancouver 25.5% vs 20.4%
Median dwelling value is notably higher than Metro Vancouver $1,600,000 vs $1,050,000
Source: Statistics Canada, Census of Population, 2021. Reproduced and distributed on an "as is" basis with the permission of Statistics Canada.
Ped NaimiPersonal Real Estate Corp
Vinod BashirPersonal Real Estate Corp
Thinking of selling in South Vancouver?
See what your home could be worth and how the local market is moving.

 1 / 37 photos