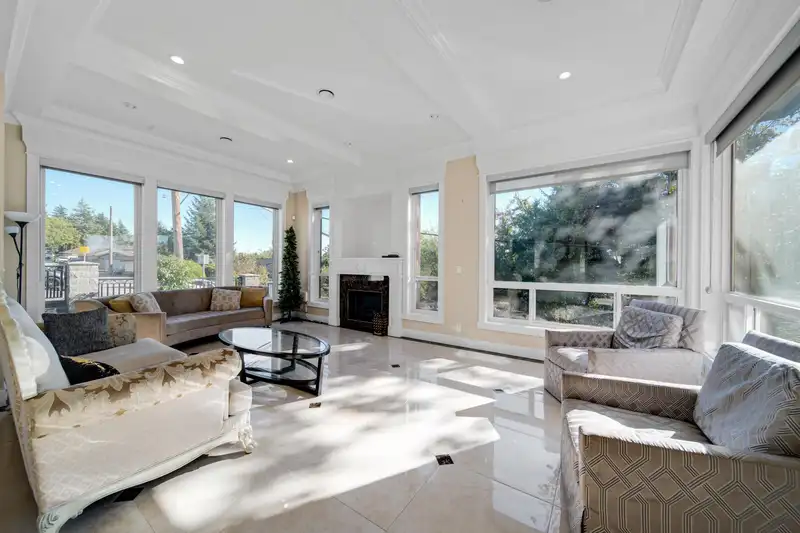
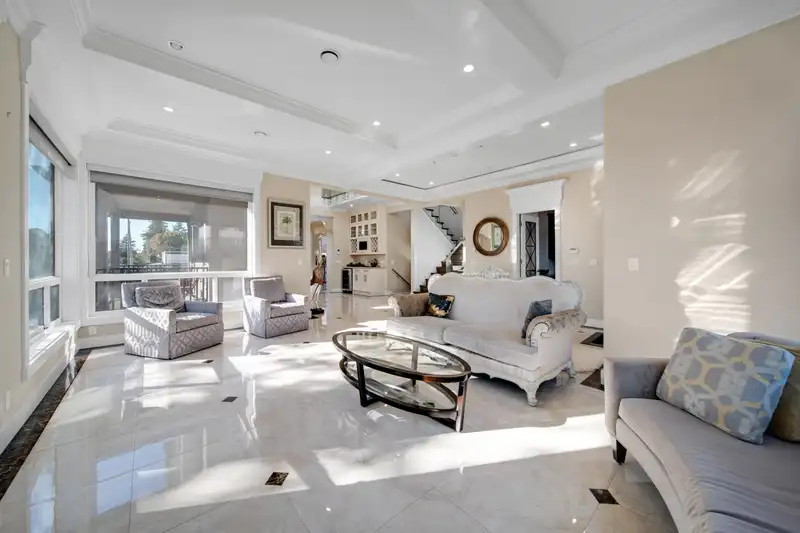
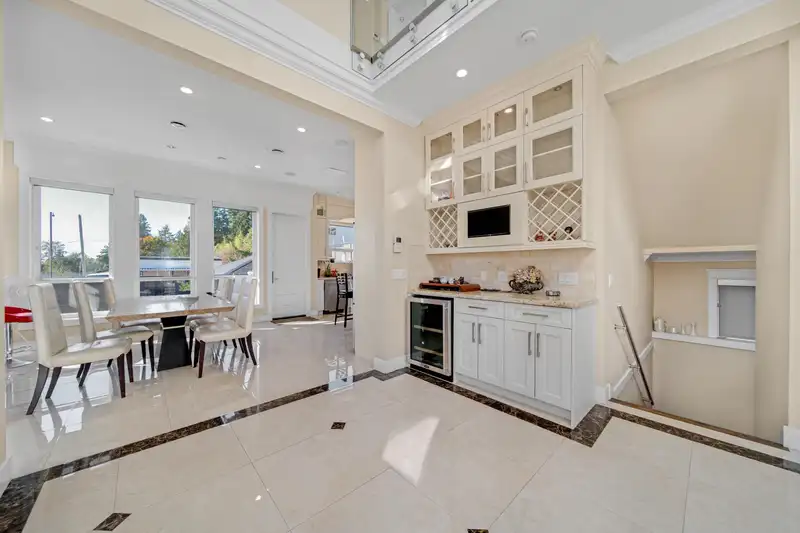
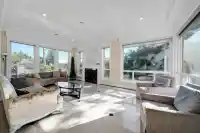
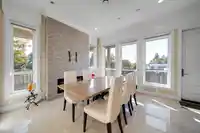
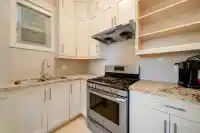
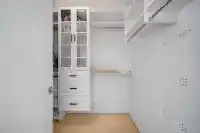
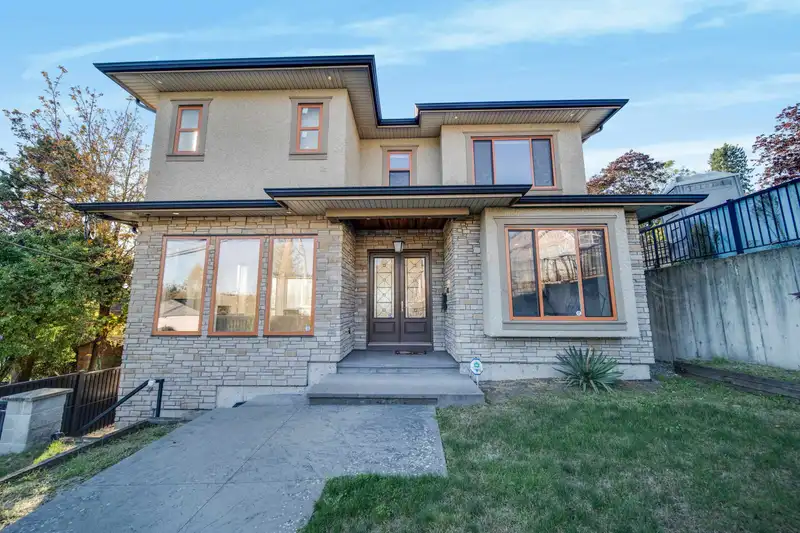
Modern Elegance Meets Prime Location Step into luxury with this immaculate, like-new modern residence nestled in one of Burnaby's most coveted neighborhoods. Thoughtfully designed with a seamless blend of style and functionality, this expansive home boasts 6 generously sized bedrooms and 6 bathrooms, including a private 2-bedroom rental suite-ideal for…
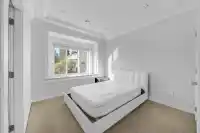
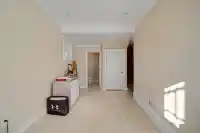
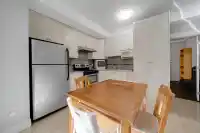
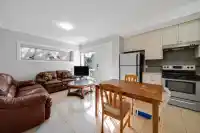
Modern Elegance Meets Prime Location Step into luxury with this immaculate, like-new modern residence nestled in one of Burnaby's most coveted neighborhoods. Thoughtfully designed with a seamless blend of style and functionality, this expansive home boasts 6 generously sized bedrooms and 6 bathrooms, including a private 2-bedroom rental suite-ideal for extended family or income potential. Enjoy the sophistication of open-concept living, accentuated by premium finishes, soaring ceilings, and abundant natural light from the west-facing backyard. Whether entertaining guest on large deck or relaxing in comfort, every detail has been curated for elevated living. Perfectly positioned just a 15-minute walk to Royal Oak SkyTrain Station and a 5-minute drive to Metrotown and T&T Supermarket.
Features
Central Vacuum
Balcony
Garage Double
Lane Access
Rear Access
Concrete
Garage Door Opener
Shopping Nearby
Room measurements14 rooms▸
Living RoomMain · 13'11 × 12'5
KitchenMain · 10' × 12'
Dining RoomMain · 7'3 × 12'
OfficeMain · 14' × 11'
Wok KitchenMain · 5'2 × 8'
Primary BedroomAbove · 13'11 × 13'
BedroomAbove · 15' × 11'
BedroomAbove · 10' × 12'10
BedroomAbove · 10' × 13'
KitchenBelow · 12' × 10'
Living RoomBelow · 11' × 9'1
BedroomBelow · 10'10 × 9'2
BedroomBelow · 12'3 × 8'10
FoyerBelow · 8'8 × 15'2
Floor plan
🔍 Tap to zoom
Pinch or scroll to zoom · drag to pan · double-tap to reset
Property Details
MLS NumberR3114170
Property TypeSingle Family Residence
Bedrooms6
Bathrooms5
Square Feet3,424
Lot Size5,950 sqft
Year Built2014
Parking Spaces2
HeatingHot Water, Radiant
Days on Market111
StatusActive
Listed ByPacific Evergreen Realty Ltd.
School Catchment
ElementaryNelson
SecondaryBurnaby South
Neighbourhood
Highlighted area = this home's census tract (StatCan), the boundary the neighbourhood stats describe.
$1,640,000Median home value
$102,000Median household income
75.6%Owner-occupied
46.2%Single-detached homes
2.9Avg household size
42.4Median age
47.1%Bachelor's degree or higher (25-64)
51.1%Commute under 30 min
75.2%Drive to work
51.3%Foreign-born residents
3,767Neighbourhood population
Age
Under 1512.9%
15 to 6468.3%
65 and over18.8%
Household size
1 person19%
232.3%
317.1%
417.9%
5 or more13.7%
Language spoken at home
41.6% English mother tongue
Mandarin16.2%
Cantonese11.6%
English + other4.7%
Punjabi4.5%
Tagalog2.7%
Korean1.6%
All others17.1%
Mother tongue, share of 3,760 residents.
How this pocket differs
notably more 5+ person households than Burnaby South 13.7% vs 7.7%
notably fewer people living alone than Burnaby South 19% vs 30.4%
more 4-person households than Burnaby South 17.9% vs 12.3%
notably more Punjabi speakers than Burnaby South 4.5% vs 2.3%
Median dwelling value is notably higher than Metro Vancouver $1,640,000 vs $1,050,000
Source: Statistics Canada, Census of Population, 2021. Reproduced and distributed on an "as is" basis with the permission of Statistics Canada.
Ped NaimiPersonal Real Estate Corp
Vinod BashirPersonal Real Estate Corp
Thinking of selling in South Slope?
See what your home could be worth and how the local market is moving.

 1 / 28 photos