
 1 / 19 photos




About This Property
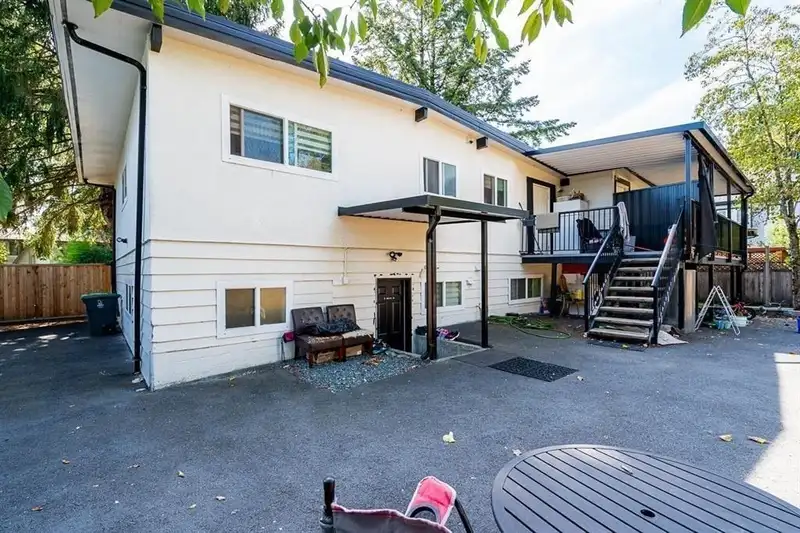
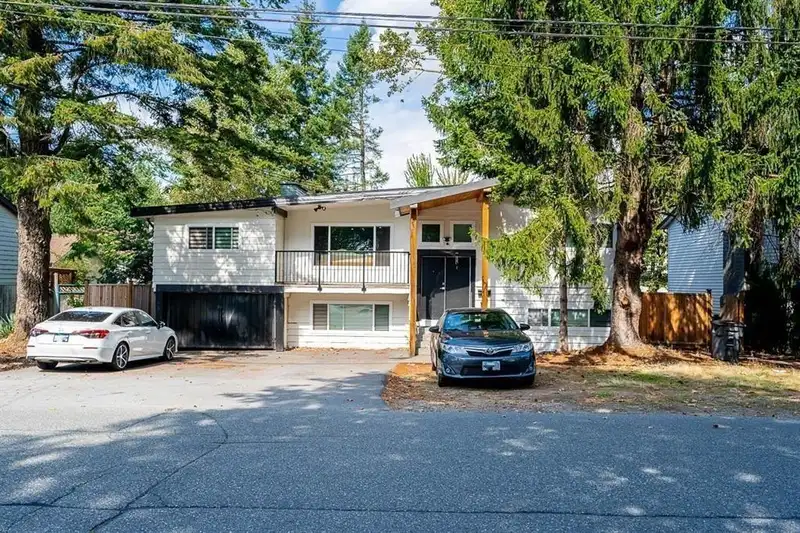
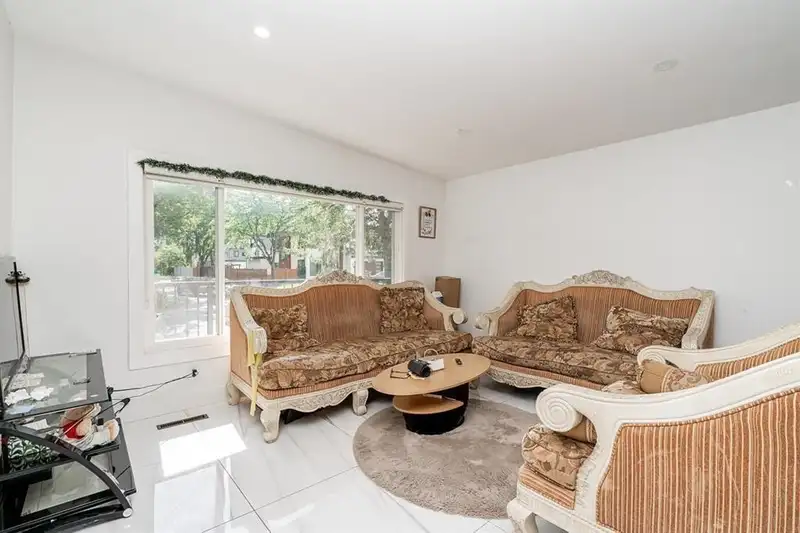
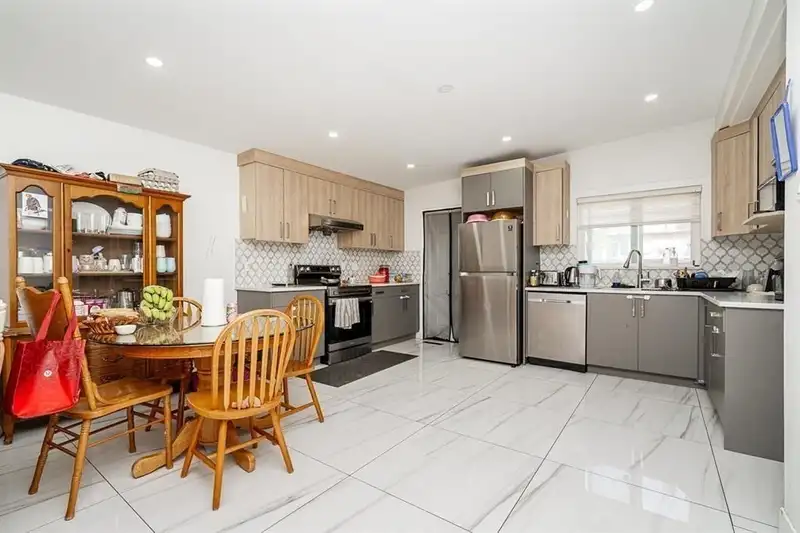
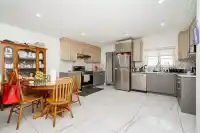
FULLY RENOVATED 6 Bed & 4Bath house with 2,683 sqft living space area along Huge 9,123 sqft rectangular lot in the prime area of Surrey! Newer Roof, Windows, Flooring, Lighting, Plumbing, Fence, Paving, Driveway & Railing, SS Appliances, Newer Washrooms and much more! Main Floor features Kitchen with Stainless Steel appliances & quartz countertop, beautiful…
Features
Property Details
School Catchment
Neighbourhood
Age
- Under 1515.6%
- 15 to 6470.4%
- 65 and over14%
Household size
- 1 person13.1%
- 220.7%
- 317.3%
- 417.6%
- 5 or more31.3%
Language spoken at home
45.8% Punjabi mother tongue
Mother tongue, share of 6,165 residents.
How this pocket differs
- fewer people living alone than East Newton 13% vs 17.5%
- more 5+ person households than East Newton 31.2% vs 25.1%
- Median household income is higher than Metro Vancouver $111,000 vs $90,000
Source: Statistics Canada, Census of Population, 2021. Reproduced and distributed on an "as is" basis with the permission of Statistics Canada.


Thinking of selling in East Newton?
See what your home could be worth and how the local market is moving.
Recent nearby sales
Sold prices are available to registered users. Log in to see what these sold for.
Monthly Cost Calculator
An estimate only. Canadian semi-annual compounding; excludes utilities, closing costs and BC property transfer tax. 5-year fixed, as of Sep 25
Similar Listings Nearby
14138 75A AVENUE
14185 74 AVENUE
7576 140 STREET
7545 143 STREET
7340 TODD CRESCENT
14339 74A AVENUE
14086 77A AVENUE
14110 72A AVENUE
14287 73A AVENUE
7258 140A STREET
7253 140A STREET
7295 140 STREET