
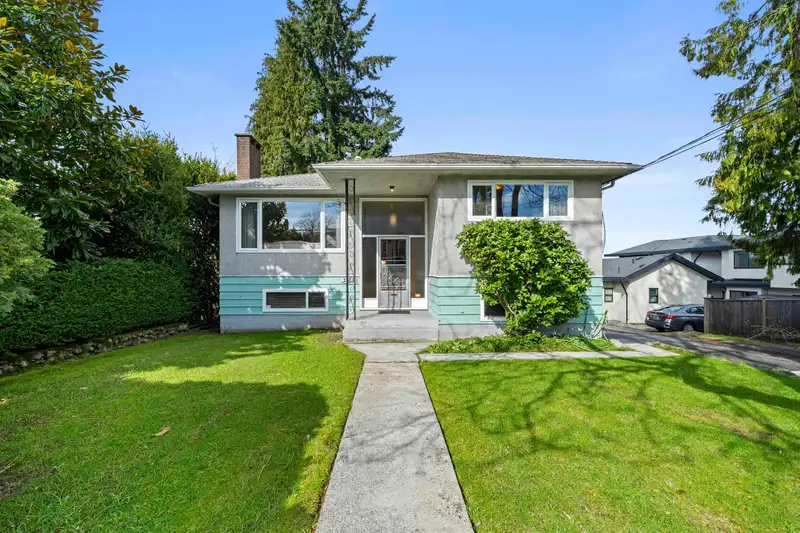
 1 / 35 photos

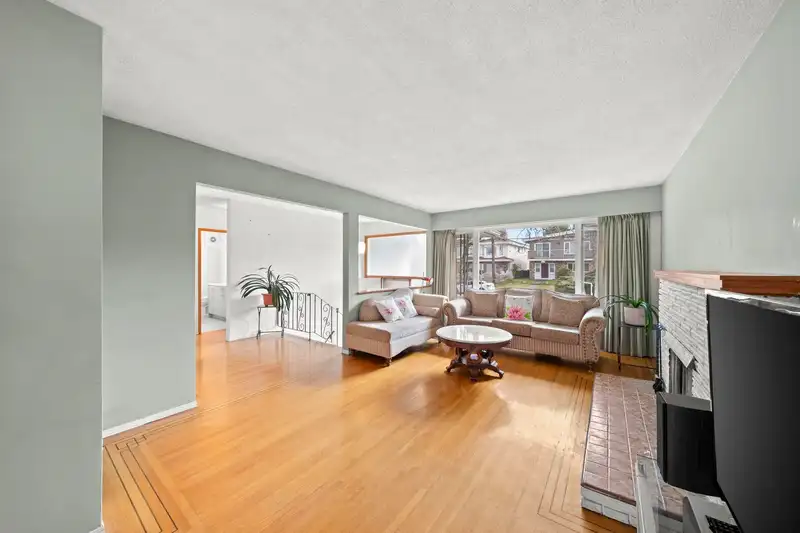













About This Property
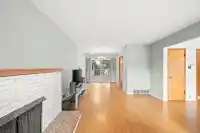
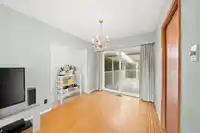
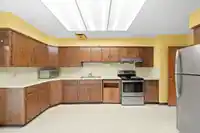
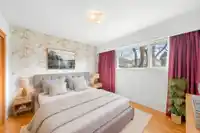
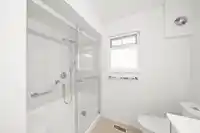
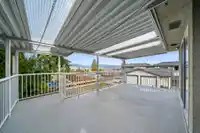
Welcome to this well-located, solid home on quiet, family-friendly Price Street in the heart of Burnaby! Proudly maintained and cared for by the owner, this property offers beautiful mountain and city views and exceptional long-term value and potential development. Located in a sought-after neighborhood, walking distance to Gilpin Elementary and within the…

Thinking of selling in Central Park BS?
See what your home could be worth and how the local market is moving.
Features
Property Details
School Catchment
Neighbourhood
Age
- Under 1513.5%
- 15 to 6468.7%
- 65 and over17.8%
Household size
- 1 person14.5%
- 227.8%
- 319.9%
- 420.3%
- 5 or more17.4%
Language spoken at home
36.1% English mother tongue
Mother tongue, share of 3,770 residents.
How this pocket differs
- notably more 5+ person households than Burnaby South 17.4% vs 7.7%
- notably fewer people living alone than Burnaby South 14.5% vs 30.4%
- notably more 4-person households than Burnaby South 20.2% vs 12.3%
- notably more Vietnamese speakers than Burnaby South 3.1% vs 1.2%
- notably more Punjabi speakers than Burnaby South 4.1% vs 2.3%
- Median dwelling value is notably higher than Metro Vancouver $1,600,000 vs $1,050,000
Source: Statistics Canada, Census of Population, 2021. Reproduced and distributed on an "as is" basis with the permission of Statistics Canada.
Recent nearby sales
Sold prices are available to registered users. Log in to see what these sold for.
Monthly Cost Calculator
An estimate only. Canadian semi-annual compounding; excludes utilities, closing costs and BC property transfer tax. 5-year fixed, as of Oct 22
Similar Listings Nearby
5010 LORRAINE AVENUE
3681 SCALES PLACE
4580 BOUNDARY ROAD
4560 BOUNDARY ROAD
3712 FIR STREET
4987 HOY STREET
4568 HOY STREET
4745 GILPIN COURT
3631 WELLINGTON AVENUE
5174 ABERDEEN STREET
4064 BURKE STREET
3696 E 26TH AVENUE