
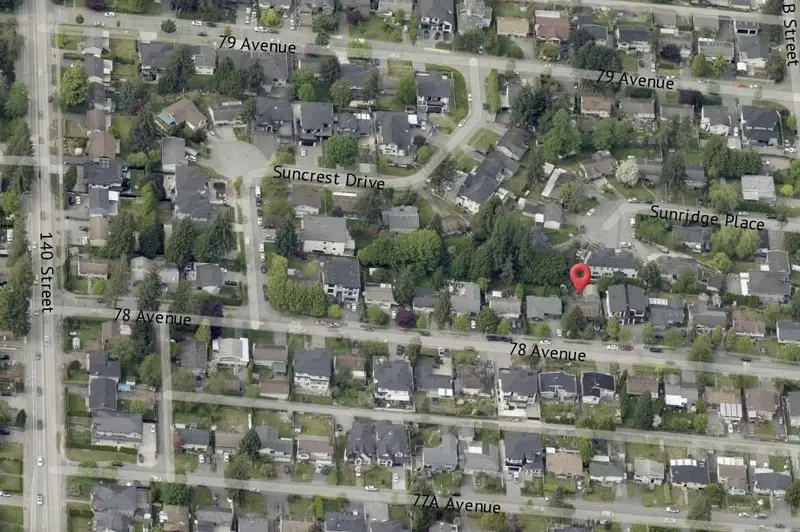
 1 / 2 photos


About This Property
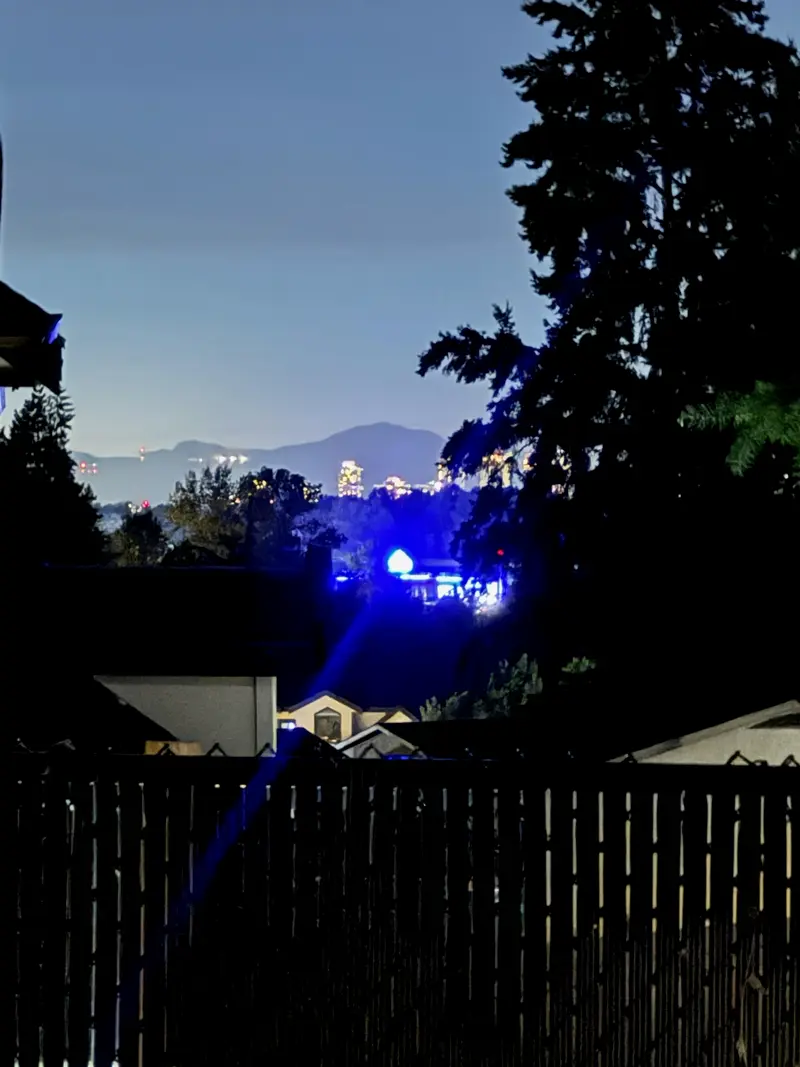
Exciting opportunity for builders, investors, and renovators! This prime view lot can accommodate a 2-storey home with a walkout basement (3-storey), offering tremendous potential. The existing home includes a basement suite, providing rental income while you plan your next project. Don’t miss out on this fantastic chance to invest and enhance in a…
Features
Property Details
School Catchment
Neighbourhood
Age
- Under 1515.6%
- 15 to 6470.4%
- 65 and over14%
Household size
- 1 person13.1%
- 220.7%
- 317.3%
- 417.6%
- 5 or more31.3%
Language spoken at home
45.8% Punjabi mother tongue
Mother tongue, share of 6,165 residents.
How this pocket differs
- fewer people living alone than East Newton 13% vs 17.5%
- more 5+ person households than East Newton 31.2% vs 25.1%
- Median household income is higher than Metro Vancouver $111,000 vs $90,000
Source: Statistics Canada, Census of Population, 2021. Reproduced and distributed on an "as is" basis with the permission of Statistics Canada.


Thinking of selling in East Newton?
See what your home could be worth and how the local market is moving.
Recent nearby sales
Sold prices are available to registered users. Log in to see what these sold for.
Monthly Cost Calculator
An estimate only. Canadian semi-annual compounding; excludes utilities, closing costs and BC property transfer tax. 5-year fixed, as of Aug 24
Similar Listings Nearby
14086 77A AVENUE
14188 77 AVENUE
7978 141A STREET
7785 143 STREET
7869 143A STREET
7876 139A STREET
7576 140 STREET
14125 75 AVENUE
14321 77 AVENUE
7919 REDTAIL PLACE
13941 80A AVENUE
8037 139A STREET